OPEN-SOURCE SCRIPT
Aktualisiert Relative Volume At Time
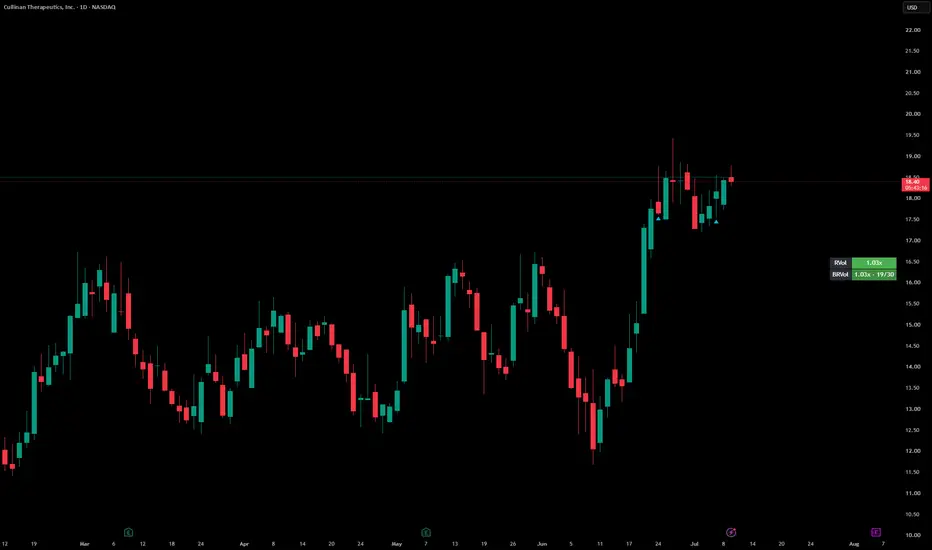
Relative Volume At Time
What it does
This indicator shows how today's trading volume compares to the typical volume for this exact point in the session — not the full day average. A value of 1.5x means the stock is pacing 50% above its normal volume for this time of day, suggesting today's session could close at ~1.5x its average daily volume.
This is the same calculation used in the TradingView screener's "Rel Vol at Time" column.
Why it matters
Standard relative volume indicators compare current volume to the full average daily volume. The problem: at 10:00 AM only 20-30% of the day's volume has typically traded, so the number is always low and hard to interpret early in the session.
Relative Volume At Time solves this by comparing apples to apples — the first 60 minutes of today vs. the first 60 minutes of the past N days. This means the reading is meaningful from the very first minutes of the session.
How it works
On intraday charts (1m, 5m, 15m, etc.):
Each bar's volume is compared to the average volume of bars at the same minute of day over the previous N sessions.
On daily charts (recommended):
The indicator fetches intraday data via request.security_lower_tf and computes the cumulative volume from session open up to the current bar. This is then compared to the average cumulative volume at the same point in time across the previous N sessions.
Interpreting the values
ValueMeaning< 1.0Below average volume — avoid, low conviction1.0 – 1.5Neutral≥ 1.5Above average — worth attention≥ 2.0Strong signal — especially powerful on breakouts
Settings
Lookback days — Number of past sessions used to calculate the average. Default: 10. Recommended: 20 for a more stable baseline (one full trading month).
Smoothing (bars) — Applies an SMA over the last N RVOL values. Keep at 1 for raw real-time readings.
Intraday resolution for daily mode — The lower timeframe used to fetch intraday volume on daily charts. Default: 1 minute for maximum accuracy.
Show current vs average volume — Displays the raw volume numbers used in the calculation, useful for debugging or verification.
Best use case
Works best as a filter for breakout and trend-following strategies on daily charts. Before entering a trade, confirm that RVOL at Time is ≥ 1.5x to ensure the move is backed by genuine volume conviction rather than low-liquidity drift.
Built-in alerts are included for ≥ 1.5x and ≥ 2.0x thresholds.
What it does
This indicator shows how today's trading volume compares to the typical volume for this exact point in the session — not the full day average. A value of 1.5x means the stock is pacing 50% above its normal volume for this time of day, suggesting today's session could close at ~1.5x its average daily volume.
This is the same calculation used in the TradingView screener's "Rel Vol at Time" column.
Why it matters
Standard relative volume indicators compare current volume to the full average daily volume. The problem: at 10:00 AM only 20-30% of the day's volume has typically traded, so the number is always low and hard to interpret early in the session.
Relative Volume At Time solves this by comparing apples to apples — the first 60 minutes of today vs. the first 60 minutes of the past N days. This means the reading is meaningful from the very first minutes of the session.
How it works
On intraday charts (1m, 5m, 15m, etc.):
Each bar's volume is compared to the average volume of bars at the same minute of day over the previous N sessions.
On daily charts (recommended):
The indicator fetches intraday data via request.security_lower_tf and computes the cumulative volume from session open up to the current bar. This is then compared to the average cumulative volume at the same point in time across the previous N sessions.
Interpreting the values
ValueMeaning< 1.0Below average volume — avoid, low conviction1.0 – 1.5Neutral≥ 1.5Above average — worth attention≥ 2.0Strong signal — especially powerful on breakouts
Settings
Lookback days — Number of past sessions used to calculate the average. Default: 10. Recommended: 20 for a more stable baseline (one full trading month).
Smoothing (bars) — Applies an SMA over the last N RVOL values. Keep at 1 for raw real-time readings.
Intraday resolution for daily mode — The lower timeframe used to fetch intraday volume on daily charts. Default: 1 minute for maximum accuracy.
Show current vs average volume — Displays the raw volume numbers used in the calculation, useful for debugging or verification.
Best use case
Works best as a filter for breakout and trend-following strategies on daily charts. Before entering a trade, confirm that RVOL at Time is ≥ 1.5x to ensure the move is backed by genuine volume conviction rather than low-liquidity drift.
Built-in alerts are included for ≥ 1.5x and ≥ 2.0x thresholds.
Versionshinweise
Relative Volume At Time + Breakout RVolWhat it does
This indicator answers two questions in one panel:
RVol — how does today's trading volume compare to the typical volume for this exact point in the session? A value of 1.5x means the stock is pacing 50% above its normal volume for this time of day, suggesting today's session could close at ~1.5x its average daily volume. This is the same calculation used in the TradingView screener's "Rel Vol at Time" column.
BRVol (Breakout RVol) — is a specific breakout being confirmed by volume? You set a pivot price; the moment price touches it, a volume timer starts. BRVol compares the volume traded since the trigger to the average volume traded in the same time-of-day window over the past N sessions. The daily number can stay low for an hour after a real breakout because it drags the quiet morning along with it — BRVol resets the clock at the moment that matters.
Why it matters
Standard relative volume indicators compare current volume to the full average daily volume. The problem: at 10:00 AM only 20-30% of the day's volume has typically traded, so the number is always low and hard to interpret early in the session. Relative Volume At Time solves this by comparing apples to apples — the first 60 minutes of today vs. the first 60 minutes of the past N days. The reading is meaningful from the very first minutes of the session.
Breakout RVol takes the same logic one step further: instead of anchoring at the session open, it anchors at your level. Breakout volume arrives with the move, not before it — so instead of judging a breakout by the pre-breakout session, BRVol gives it a defined window (e.g. 30 bars) to prove itself, then renders a verdict.
How it works
On intraday charts (1m, 5m, 15m, etc.): each bar's volume is compared to the average volume of bars at the same minute of day over the previous N sessions.
On daily charts: the indicator fetches intraday data via request.security_lower_tf and computes the cumulative volume from session open up to the current bar, compared to the average cumulative volume at the same point in time across the previous N sessions.
Breakout RVol (intraday charts only): set a pivot price in the settings. The first bar whose high touches the pivot starts the timer (a triangle marks the bar; the pivot is drawn as a horizontal line). The status cell then shows the ratio and elapsed bars, e.g. "1.24x · 18/30":
Gray — armed: waiting for the pivot to be touched. Re-arms automatically every session.
Orange — counting: inside the confirm window, no verdict yet.
Green — confirmed: BRVol reached your threshold. The breakout is drawing real participation.
Red — failed: the confirm window elapsed with BRVol below threshold. The breakout found no volume.
If the session gaps above the pivot, the timer starts from the first bar of the day. With pivot = 0 the feature is fully off and the indicator behaves exactly as before.
Interpreting the values
ValueMeaning< 1.0Below average volume — avoid, low conviction1.0 – 1.5Neutral≥ 1.5Above average — worth attention≥ 2.0Strong signal — especially powerful on breakouts
The same scale applies to both numbers: RVol grades the session, BRVol grades your breakout. The first 1-2 bars after a trigger read slightly low by construction (a partially formed live bar vs. full historical bars) — judge BRVol from ~bar 5 onward.
Settings
Lookback days — Number of past sessions used to calculate the average, shared by both RVol and BRVol. Default: 10.
Smoothing (bars) — Applies an SMA over the last N RVOL values. Keep at 1 for raw real-time readings (does not affect BRVol, which is cumulative and inherently smooth).
Intraday resolution for daily mode — The lower timeframe used to fetch intraday volume on daily charts. Default: 1 minute for maximum accuracy.
Show current vs average volume — Displays the raw volume numbers used in the calculation, useful for debugging or verification.
Pivot price — The breakout level BRVol watches. 0 = feature off.
Confirm window (bars) — How many bars the breakout gets to prove itself. 30 bars on a 1m chart = 30 minutes; 6 bars on a 5m chart = 30 minutes.
Min BRVol to confirm — The ratio that turns the verdict green. Default 1.0; demand 1.5 if you only want strongly confirmed breakouts.
Best use case
RVol works best as a session-level filter for breakout and trend-following strategies on daily charts — before entering, confirm ≥ 1.5x to ensure the move is backed by genuine conviction rather than low-liquidity drift.
BRVol is the entry companion on 1m/5m charts: type in your pivot before the open, take the trade on the trigger, and let the confirm window decide — green means the breakout earned its volume, red means cut it before the stop does it for you.
Built-in alerts: RVol ≥ 1.5x, RVol ≥ 2x, BRVol trigger, BRVol confirmed, BRVol failed.
Versionshinweise
Ето го цялото, с трите патча вече вградени — маркирай, копирай, паствай:---
**Relative Volume At Time + Breakout RVol**
**What it does**
This indicator answers two questions in one panel:
**RVol** — how does today's trading volume compare to the typical volume for this exact point in the session? A value of 1.5x means the stock is pacing 50% above its normal volume for this time of day, suggesting today's session could close at ~1.5x its average daily volume. This is the same calculation used in the TradingView screener's "Rel Vol at Time" column.
**BRVol (Breakout RVol)** — is a *specific breakout* being confirmed by volume? You set a pivot price; the moment price touches it, a volume timer starts. BRVol compares the volume traded *since the trigger* to the average volume traded in the same time-of-day window over the past N sessions. The daily number can stay low for an hour after a real breakout because it drags the quiet morning along with it — BRVol resets the clock at the moment that matters.
**Why it matters**
Standard relative volume indicators compare current volume to the full average daily volume. The problem: at 10:00 AM only 20-30% of the day's volume has typically traded, so the number is always low and hard to interpret early in the session. Relative Volume At Time solves this by comparing apples to apples — the first 60 minutes of today vs. the first 60 minutes of the past N days. The reading is meaningful from the very first minutes of the session.
Breakout RVol takes the same logic one step further: instead of anchoring at the session open, it anchors at *your* level. Breakout volume arrives *with* the move, not before it — so instead of judging a breakout by the pre-breakout session, BRVol gives it a defined window (e.g. 30 bars) to prove itself, then renders a verdict.
**How it works**
On intraday charts (1m, 5m, 15m, etc.): each bar's volume is compared to the average volume of bars at the same minute of day over the previous N sessions.
On daily charts: the indicator fetches intraday data via request.security_lower_tf and computes the cumulative volume from session open up to the current bar, compared to the average cumulative volume at the same point in time across the previous N sessions.
Breakout RVol (intraday and daily charts): set a pivot price in the settings. The first bar whose high touches the pivot starts the timer (a triangle marks the bar; the pivot is drawn as a horizontal line). On intraday charts the window counts chart bars. On daily charts the window is built from intraday data — the same engine daily-mode RVol runs on — so the verdict updates minute by minute right on the daily chart, without opening a lower timeframe. The status cell shows the ratio and elapsed bars, e.g. "1.24x · 18/30":
- **Gray — armed**: waiting for the pivot to be touched. Re-arms automatically every session.
- **Orange — counting**: inside the confirm window, no verdict yet.
- **Green — confirmed**: BRVol reached your threshold. The breakout is drawing real participation.
- **Red — failed**: the confirm window elapsed with BRVol below threshold. The breakout found no volume.
If the session gaps above the pivot, the timer starts from the first bar of the day. On a gap-over day the window is the whole session, so BRVol and RVol converge to the same number — as they should. With pivot = 0 the feature is fully off and the indicator behaves exactly as before.
**Interpreting the values**
| Value | Meaning |
|---|---|
| < 1.0 | Below average volume — avoid, low conviction |
| 1.0 – 1.5 | Neutral |
| ≥ 1.5 | Above average — worth attention |
| ≥ 2.0 | Strong signal — especially powerful on breakouts |
The same scale applies to both numbers: RVol grades the session, BRVol grades your breakout. The first 1-2 bars after a trigger read slightly low by construction (a partially formed live bar vs. full historical bars) — judge BRVol from ~bar 5 onward.
**Settings**
Lookback days — Number of past sessions used to calculate the average, shared by both RVol and BRVol. Default: 10.
Smoothing (bars) — Applies an SMA over the last N RVOL values. Keep at 1 for raw real-time readings (does not affect BRVol, which is cumulative and inherently smooth).
Intraday resolution for daily mode — The lower timeframe used to fetch intraday volume on daily charts. Default: 1 minute for maximum accuracy. Also defines the confirm-window unit for Breakout RVol on daily charts.
Show current vs average volume — Displays the raw volume numbers used in the calculation, useful for debugging or verification.
Pivot price — The breakout level BRVol watches. 0 = feature off.
Confirm window (bars) — How many bars the breakout gets to prove itself. 30 bars on a 1m chart = 30 minutes; 6 bars on a 5m chart = 30 minutes; on a daily chart the window counts bars of the "Intraday resolution for daily mode" setting — with the default 1-minute resolution, 30 = 30 minutes there too.
Min BRVol to confirm — The ratio that turns the verdict green. Default 1.0; demand 1.5 if you only want strongly confirmed breakouts.
**Best use case**
RVol works best as a session-level filter for breakout and trend-following strategies on daily charts — before entering, confirm ≥ 1.5x to ensure the move is backed by genuine volume conviction rather than low-liquidity drift.
BRVol is the entry companion on any chart, including the daily you already watch: type in your pivot before the open, take the trade on the trigger, and let the confirm window decide — green means the breakout earned its volume, red means cut it before the stop does it for you.
Built-in alerts: RVol ≥ 1.5x, RVol ≥ 2x, BRVol trigger, BRVol confirmed, BRVol failed. Create the BRVol alerts with "Once per bar" frequency.
Versionshinweise
Relative Volume At Time + Breakout RVol [Galin]What it does
This indicator answers two questions in one panel:
RVol — how does today's trading volume compare to the typical volume for this exact point in the session? A value of 1.5x means the stock is pacing 50% above its normal volume for this time of day, suggesting today's session could close at ~1.5x its average daily volume. This is the same calculation used in the TradingView screener's "Rel Vol at Time" column.
BRVol (Breakout RVol) — is a *specific breakout* being confirmed by volume? You set a pivot price; the moment price touches it, a volume timer starts. BRVol compares the volume traded *since the trigger* to the average volume traded in the same time-of-day window over the past N sessions. The daily number can stay low for an hour after a real breakout because it drags the quiet morning along with it — BRVol resets the clock at the moment that matters.
Why it matters
Standard relative volume indicators compare current volume to the full average daily volume. The problem: at 10:00 AM only 20-30% of the day's volume has typically traded, so the number is always low and hard to interpret early in the session. Relative Volume At Time solves this by comparing apples to apples — the first 60 minutes of today vs. the first 60 minutes of the past N days. The reading is meaningful from the very first minutes of the session.
Breakout RVol takes the same logic one step further: instead of anchoring at the session open, it anchors at *your* level. Breakout volume arrives *with* the move, not before it — so instead of judging a breakout by the pre-breakout session, BRVol gives it a defined window (e.g. 30 bars) to prove itself, then renders a verdict.
**How it works**
On intraday charts (1m, 5m, 15m, etc.): each bar's volume is compared to the average volume of bars at the same minute of day over the previous N sessions.
On daily charts: the indicator fetches intraday data via request.security_lower_tf and computes the cumulative volume from session open up to the current bar, compared to the average cumulative volume at the same point in time across the previous N sessions.
Breakout RVol (intraday and daily charts): set a pivot price in the settings. The first bar whose high touches the pivot starts the timer (a triangle marks the bar; the pivot is drawn as a horizontal line). On intraday charts the window counts chart bars. On daily charts the window is built from intraday data — the same engine daily-mode RVol runs on — so the verdict updates minute by minute right on the daily chart, without opening a lower timeframe. The status cell shows the ratio and elapsed bars, e.g. "1.24x · 18/30":
- Gray — armed: waiting for the pivot to be touched. Re-arms automatically every session.
- Orange — counting: inside the confirm window, no verdict yet.
- Green — confirmed: BRVol reached your threshold. The breakout is drawing real participation.
- Red — failed: the confirm window elapsed with BRVol below threshold. The breakout found no volume.
If the session gaps above the pivot, the timer starts from the first bar of the day. On a gap-over day the window is the whole session, so BRVol and RVol converge to the same number — as they should. With pivot = 0 the feature is fully off and the indicator behaves exactly as before.
Interpreting the values
| Value | Meaning |
< 1.0 | Below average volume — avoid, low conviction |
1.0 – 1.5 | Neutral |
≥ 1.5 | Above average — worth attention |
≥ 2.0 | Strong signal — especially powerful on breakouts |
The same scale applies to both numbers: RVol grades the session, BRVol grades your breakout. The first 1-2 bars after a trigger read slightly low by construction (a partially formed live bar vs. full historical bars) — judge BRVol from ~bar 5 onward.
Settings
Lookback days — Number of past sessions used to calculate the average, shared by both RVol and BRVol. Default: 10.
Smoothing (bars) — Applies an SMA over the last N RVOL values. Keep at 1 for raw real-time readings (does not affect BRVol, which is cumulative and inherently smooth).
Intraday resolution for daily mode — The lower timeframe used to fetch intraday volume on daily charts. Default: 1 minute for maximum accuracy. Also defines the confirm-window unit for Breakout RVol on daily charts.
Show current vs average volume — Displays the raw volume numbers used in the calculation, useful for debugging or verification.
Pivot price — The breakout level BRVol watches. 0 = feature off.
Confirm window (bars) — How many bars the breakout gets to prove itself. 30 bars on a 1m chart = 30 minutes; 6 bars on a 5m chart = 30 minutes; on a daily chart the window counts bars of the "Intraday resolution for daily mode" setting — with the default 1-minute resolution, 30 = 30 minutes there too.
Min BRVol to confirm — The ratio that turns the verdict green. Default 1.0; demand 1.5 if you only want strongly confirmed breakouts.
Best use case
RVol works best as a session-level filter for breakout and trend-following strategies on daily charts — before entering, confirm ≥ 1.5x to ensure the move is backed by genuine volume conviction rather than low-liquidity drift.
BRVol is the entry companion on any chart, including the daily you already watch: type in your pivot before the open, take the trade on the trigger, and let the confirm window decide — green means the breakout earned its volume, red means cut it before the stop does it for you.
Built-in alerts: RVol ≥ 1.5x, RVol ≥ 2x, BRVol trigger, BRVol confirmed, BRVol failed. Create the BRVol alerts with "Once per bar" frequency.
Open-source Skript
Ganz im Sinne von TradingView hat dieser Autor sein/ihr Script als Open-Source veröffentlicht. Auf diese Weise können nun auch andere Trader das Script rezensieren und die Funktionalität überprüfen. Vielen Dank an den Autor! Sie können das Script kostenlos verwenden, aber eine Wiederveröffentlichung des Codes unterliegt unseren Hausregeln.

Haftungsausschluss
Die Informationen und Veröffentlichungen sind nicht als Finanz-, Anlage-, Handels- oder andere Arten von Ratschlägen oder Empfehlungen gedacht, die von TradingView bereitgestellt oder gebilligt werden, und stellen diese nicht dar. Lesen Sie mehr in den Nutzungsbedingungen.
Open-source Skript
Ganz im Sinne von TradingView hat dieser Autor sein/ihr Script als Open-Source veröffentlicht. Auf diese Weise können nun auch andere Trader das Script rezensieren und die Funktionalität überprüfen. Vielen Dank an den Autor! Sie können das Script kostenlos verwenden, aber eine Wiederveröffentlichung des Codes unterliegt unseren Hausregeln.
Haftungsausschluss
Die Informationen und Veröffentlichungen sind nicht als Finanz-, Anlage-, Handels- oder andere Arten von Ratschlägen oder Empfehlungen gedacht, die von TradingView bereitgestellt oder gebilligt werden, und stellen diese nicht dar. Lesen Sie mehr in den Nutzungsbedingungen.