Aktualisiert
[blackcat] L1 Variable Index Dynamic Average (VIDYA)
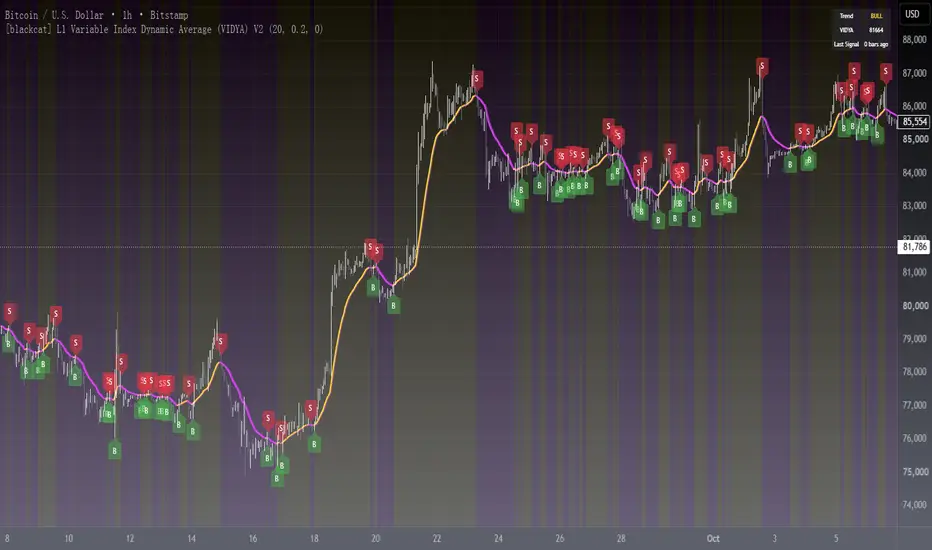
Variable Index Dynamic Average (VIDYA) is a technical indicator that adjusts its sensitivity to market volatility. VIDYA is an exponential moving average (EMA) that uses the standard deviation of price as a measure of volatility. When the market is volatile, the indicator places more weight on recent prices, and when the market is stable, it places more weight on older prices. This makes VIDYA more responsive to market conditions than a regular EMA.
This script is a powerful tool that traders can use to gain valuable insights into market trends and make informed trading decisions. The L1 Variable Index Dynamic Average (VIDYA) is a technical indicator that adjusts its sensitivity to market volatility, making it more responsive to market conditions than a regular EMA. By incorporating the standard deviation of price as a measure of volatility, VIDYA can provide a more accurate representation of the market's current state, which can be especially useful in volatile markets.
One of the key features of this script is that it allows the user to customize the period and alpha inputs used in the VIDYA calculation. This means that traders can tailor the indicator to their specific trading strategies and preferences. By adjusting the period and alpha inputs, traders can fine-tune the sensitivity of the indicator to match the volatility of the market they're trading in.
In addition to plotting the VIDYA line on the chart, this script generates alerts and labels for buy and sell signals based on the crossover and crossunder of the VIDYA line. These alerts and labels can be incredibly helpful in identifying potential trading opportunities and avoiding costly mistakes. By being alerted to buy and sell signals in real-time, traders can take advantage of market movements and make trades quickly and confidently.
Another advantage of this script is that it is written in TradingView's Pine programming language, which is specifically designed for technical analysis and trading. Pine is a user-friendly language that allows traders to create custom indicators and strategies without having to learn a complex programming language. This means that even traders with little to no programming experience can use this script to gain valuable insights into the market.
Overall, this script is an excellent tool for traders who are looking for a powerful and customizable technical indicator that can help them make informed trading decisions. With its ability to adjust to market volatility, generate alerts and labels, and be customized to match individual trading strategies, the L1 Variable Index Dynamic Average (VIDYA) is a valuable addition to any trader's toolkit.
This script is a powerful tool that traders can use to gain valuable insights into market trends and make informed trading decisions. The L1 Variable Index Dynamic Average (VIDYA) is a technical indicator that adjusts its sensitivity to market volatility, making it more responsive to market conditions than a regular EMA. By incorporating the standard deviation of price as a measure of volatility, VIDYA can provide a more accurate representation of the market's current state, which can be especially useful in volatile markets.
One of the key features of this script is that it allows the user to customize the period and alpha inputs used in the VIDYA calculation. This means that traders can tailor the indicator to their specific trading strategies and preferences. By adjusting the period and alpha inputs, traders can fine-tune the sensitivity of the indicator to match the volatility of the market they're trading in.
In addition to plotting the VIDYA line on the chart, this script generates alerts and labels for buy and sell signals based on the crossover and crossunder of the VIDYA line. These alerts and labels can be incredibly helpful in identifying potential trading opportunities and avoiding costly mistakes. By being alerted to buy and sell signals in real-time, traders can take advantage of market movements and make trades quickly and confidently.
Another advantage of this script is that it is written in TradingView's Pine programming language, which is specifically designed for technical analysis and trading. Pine is a user-friendly language that allows traders to create custom indicators and strategies without having to learn a complex programming language. This means that even traders with little to no programming experience can use this script to gain valuable insights into the market.
Overall, this script is an excellent tool for traders who are looking for a powerful and customizable technical indicator that can help them make informed trading decisions. With its ability to adjust to market volatility, generate alerts and labels, and be customized to match individual trading strategies, the L1 Variable Index Dynamic Average (VIDYA) is a valuable addition to any trader's toolkit.
Versionshinweise
upgrade to v5Versionshinweise
OVERVIEWThe [blackcat] L1 Variable Index Dynamic Average (VIDYA) indicator provides a unique moving average calculation that adapts to market volatility. By incorporating standard deviation and exponential smoothing, VIDYA offers a dynamic approach to identifying trends and potential trade opportunities. This indicator plots the dynamic average line along with shaded areas indicating trend direction, helping traders make informed decisions 📈💹.
FEATURES
Calculates a Variable Index Dynamic Average (VIDYA) using custom functions:
Period: Length of the moving average window.
Alpha: Smoothing factor affecting the responsiveness of the average.
Plots two lines representing the current and previous dynamic averages:
Current: Yellow line.
Previous: Fuchsia line.
Shades the area between the two lines to indicate trend direction:
Bullish trend: Yellow shading.
Bearish trend: Fuchsia shading.
Generates buy ('B') and sell ('S') labels on the chart for quick identification 🏷️
Produces alerts when crossover events occur, signaling potential trades 🔔
HOW TO USE
Add the indicator to your TradingView chart by selecting it from the indicators list.
Adjust the Period and Alpha inputs to customize the sensitivity of the dynamic average ⚙️.
Monitor the chart for buy and sell labels indicating potential trade opportunities.
Set up alerts based on the generated signals to receive notifications when conditions are met 📲.
Use the shaded areas as additional context for trend analysis.
LIMITATIONS
The indicator may lag behind rapid price movements due to its smoothing nature.
False signals can occur in highly volatile or choppy markets 🌪️.
Users should confirm signals with other technical tools for better reliability.
NOTES
Ensure that you have sufficient historical data available for accurate calculations.
Test the indicator thoroughly on demo accounts before applying it to live trading 🔍.
Experiment with different parameter settings to find what works best for your trading style.
Versionshinweise
█ OVERVIEWVIDYA is an adaptive moving average whose effective smoothing speed changes with market volatility — it accelerates when price dispersion expands and tightens when markets go quiet. This V2 release upgrades the original L1 VIDYA with close-confirmed alerts, a live trend dashboard, signal cooldown, and zero-division protection for dead-quiet symbols.
█ CONCEPTS
The Variable Index Dynamic Average belongs to the adaptive-MA family: instead of one fixed smoothing length, its responsiveness is modulated by market conditions.
Key principles:
• Dispersion measurement: the standard deviation of close over the lookback window captures how far price is scattering
• Smoothed normalization: a WMA of that deviation forms a self-scaling denominator, so an identical price gap means more in quiet tape than in violent tape
• Gap amplification: the distance between close and its EMA, scaled by Alpha over that denominator, nudges the baseline EMA toward price
• Slope as state: VIDYA above its own previous value = bullish; below = bearish
█ HOW TO USE
1 — Add the script to any chart; defaults suit most symbols and timeframes
2 — Tune Period (default 20) and Alpha (default 0.2) to control reactivity
3 — Read the two-tone line and fill for trend direction; act on the B / S labels at slope flips
4 — Create alerts from the "VIDYA Buy" / "VIDYA Sell" conditions, or pick "Any alert() function call"
Input Parameters
• Period (int, default 20, min 1): lookback shared by the EMA, stdev and WMA stages
• Alpha (float, default 0.2, range 0-1, step 0.05): adaptive gain — higher values hug price more closely
• Cooldown Bars (int, default 0): minimum bars between signals; 0 disables the filter (original behavior)
• Bullish / Bearish Color: palette for the line and ribbon fill
• Show Ribbon Fill / Trend Background / Buy-Sell Labels / Dashboard: visual toggles, all on by default
█ FEATURES
• Adaptive trend line with dynamic two-tone ribbon fill
• Green "B" and red "S" signal labels at slope turns
• Trend background tint for instant regime reading
• Dashboard (top-right): current trend, VIDYA value, bars since last signal
• Two alertcondition hooks plus dynamic alert() messages — all confirmed once per bar close, no intrabar repainting
• Robust math: denominator floored at syminfo.mintick, na-guarded history
█ SIGNALS
Visual Elements
• Yellow line and fill: bullish slope (VIDYA rising vs previous bar)
• Fuchsia line and fill: bearish slope (VIDYA falling)
• Green B label below a bar: VIDYA turned up — potential long entry
• Red S label above a bar: VIDYA turned down — potential short entry or long exit
• Background tint mirrors the current slope state; the dashboard summarizes it numerically
█ IMPLEMENTATION NOTES
Open source, built with ta.ema, ta.stdev, ta.wma and ta.crossover. All ta.* calls run on every bar — no conditional-history bias. No request.security is used, so nothing repaints from higher timeframes; B/S signals fire on the confirmed bar close. The core line:
█ LIMITATIONS
• Trend-following by design — expect whipsaws in tight ranging markets
• Signals confirm at bar close: no repaint, but never the earliest possible tick
• Cooldown is optional and off by default; raise it to thin out choppy signals
• Not a standalone system — combine with market structure, context and risk management
█ NOTES
• V2 changelog: unified close-confirmed alerts, alertcondition hooks, cooldown filter, dashboard, trend background, customizable colors, input validation, zero-division guard
• Core algorithm by blackcat1402, the L1 VIDYA, published under Mozilla Public License 2.0 — this V2 keeps the same open license
• Works on every symbol and timeframe; 15m and above generally give the most stable signals
════════════════════════════════════════════════════════════════════════
For questions or feedback, please use the comments section below.
Feel free to use and modify — attribution appreciated.

Don't miss out! The first and most important thing to do is to join my Discord chat now! Click here to start your adventure: discord.com/invite/ZTGpQJq My new github for more pine development soon: github.com/wxt-coder
Haftungsausschluss
Die Informationen und Veröffentlichungen sind nicht als Finanz-, Anlage-, Handels- oder andere Arten von Ratschlägen oder Empfehlungen gedacht, die von TradingView bereitgestellt oder gebilligt werden, und stellen diese nicht dar. Lesen Sie mehr in den Nutzungsbedingungen.
Don't miss out! The first and most important thing to do is to join my Discord chat now! Click here to start your adventure: discord.com/invite/ZTGpQJq My new github for more pine development soon: github.com/wxt-coder
Haftungsausschluss
Die Informationen und Veröffentlichungen sind nicht als Finanz-, Anlage-, Handels- oder andere Arten von Ratschlägen oder Empfehlungen gedacht, die von TradingView bereitgestellt oder gebilligt werden, und stellen diese nicht dar. Lesen Sie mehr in den Nutzungsbedingungen.