OPEN-SOURCE SCRIPT
Detrended Price Oscillator - Valuation and Trend | Astral Vision
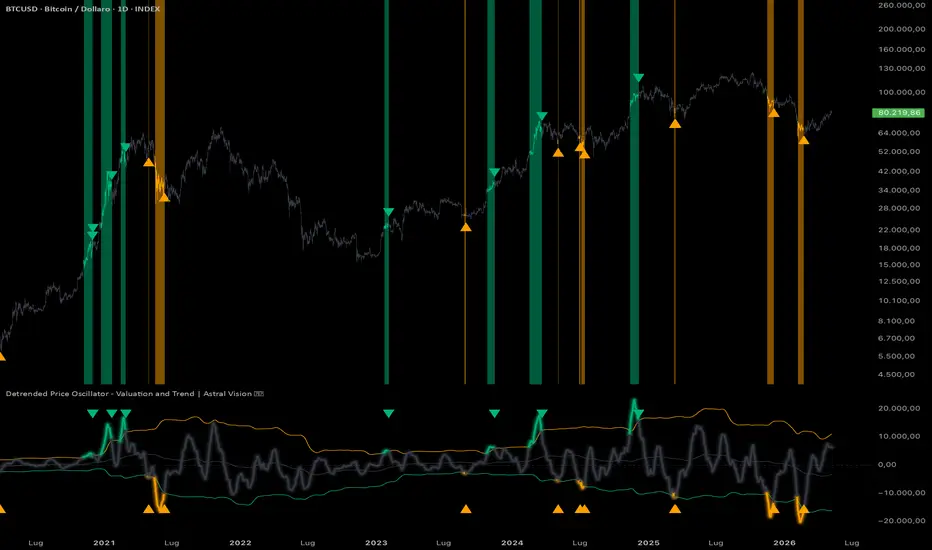
Detrended Price Oscillator - Valuation and Trend | Astral Vision 🌠💠
The Detrended Price Oscillator removes the dominant trend from price by subtracting a lagged moving average, isolating the cyclical component that trends obscure.
The result is an oscillator centered around zero that reflects how far price has deviated from its medium-term mean, independent of whether the broader trend is up or down.
This indicator extends the standard DPO with two structural additions.
First, dynamic overbought and oversold bands are derived from the rolling standard deviation of the DPO itself, making the extremes statistically adaptive rather than fixed.
Second, an optional moving average smoothing layer can be applied to the DPO before all calculations, reducing noise on lower timeframes.
Two modes cover different use cases:
"Extremes" identifies statistically significant deviations from the mean with explicit entry/exit signals, while "Trend" tracks whether the smoothed DPO is above or below its rolling mean as a directional read.
Calculation ⚙️
`DPO = close − SMA(close, length)[length/2 + 1]`
The lookback shift centers the moving average on the period being measured, removing the trend component while preserving cyclical deviations. An optional EMA or SMA of configurable length can then be applied to the raw DPO.
`Overbought = SMA(DPO, stdLookback) + ob_multiplier × StdDev(DPO, stdLookback)`
`Oversold = SMA(DPO, stdLookback) − os_multiplier × StdDev(DPO, stdLookback)`
Both bands float dynamically with the evolving distribution of DPO values, tightening during low-volatility periods and expanding during high-volatility ones.
Plots 📊
Inputs 🎛️
Colors 🎨
5 Astral Vision presets + custom override. Default: Hermes. Positive color activates at oversold extremes and above-mean trend; negative color activates at overbought extremes and below-mean trend; neutral applies to the mean line.
Purpose 🎯
Standard DPO implementations plot a raw oscillator with no threshold logic and no statistical context, leaving the trader to visually judge whether a given deviation is significant or routine. Fixed overbought/oversold levels carry no meaning as market volatility changes over time.
This indicator makes the extremes statistically rigorous: the bands adapt to the actual distribution of DPO values over the chosen lookback, so a breach always represents a genuinely unusual deviation regardless of the prevailing volatility regime.
The signal markers fire specifically on band re-entries, not on the initial breach, identifying the moment mean reversion has begun rather than flagging the extreme itself.
The six-layer glow rendering makes the oscillator's position relative to its bands immediately readable at a glance without requiring precise level inspection.
Disclaimer ⭕️
It is not financial advice, not an investment recommendation, and not affiliated with any financial institution, research firm, or organization of any kind. All content is provided for educational and informational purposes only. Always conduct your own research before making any financial decision.
The Detrended Price Oscillator removes the dominant trend from price by subtracting a lagged moving average, isolating the cyclical component that trends obscure.
The result is an oscillator centered around zero that reflects how far price has deviated from its medium-term mean, independent of whether the broader trend is up or down.
This indicator extends the standard DPO with two structural additions.
First, dynamic overbought and oversold bands are derived from the rolling standard deviation of the DPO itself, making the extremes statistically adaptive rather than fixed.
Second, an optional moving average smoothing layer can be applied to the DPO before all calculations, reducing noise on lower timeframes.
Two modes cover different use cases:
"Extremes" identifies statistically significant deviations from the mean with explicit entry/exit signals, while "Trend" tracks whether the smoothed DPO is above or below its rolling mean as a directional read.
Calculation ⚙️
`DPO = close − SMA(close, length)[length/2 + 1]`
The lookback shift centers the moving average on the period being measured, removing the trend component while preserving cyclical deviations. An optional EMA or SMA of configurable length can then be applied to the raw DPO.
`Overbought = SMA(DPO, stdLookback) + ob_multiplier × StdDev(DPO, stdLookback)`
`Oversold = SMA(DPO, stdLookback) − os_multiplier × StdDev(DPO, stdLookback)`
Both bands float dynamically with the evolving distribution of DPO values, tightening during low-volatility periods and expanding during high-volatility ones.
Plots 📊
- DPO line with 6-layer glow (linewidths 12/8/5/3/2/1, transparencies 88/78/65/50/30/0), colored by active regime
- Dynamic overbought and oversold band lines
- Rolling mean line
- Zero baseline (dashed)
- Triangle signals in the panel and on the price chart when DPO crosses back inside a band from an extreme (Extremes mode, signals enabled)
- Candle coloring on the price chart by active regime
- Background highlight on the price chart when either band is breached (Extremes mode)
Inputs 🎛️
- `Mode`: Extremes (band-crossing signals) or Trend (mean-relative direction)
- `DPO Length`: period of the internal SMA used to detrend price (default 21)
- `StDev Lookback`: rolling window for mean and standard deviation of the DPO (default 250)
- `Oversold StDev Multiplier`: band distance below the mean (default 1.8)
- `Overbought StDev Multiplier`: band distance above the mean (default 2.0)
- `Show Signals`: toggles triangle markers for band re-entry crossings
- `Use Moving Average` applies a smoothing MA to the DPO before all calculations
- `Moving Average Length` : period of the smoothing MA (default 10)
- `Moving Average Type`: EMA or SMA
Colors 🎨
5 Astral Vision presets + custom override. Default: Hermes. Positive color activates at oversold extremes and above-mean trend; negative color activates at overbought extremes and below-mean trend; neutral applies to the mean line.
Purpose 🎯
Standard DPO implementations plot a raw oscillator with no threshold logic and no statistical context, leaving the trader to visually judge whether a given deviation is significant or routine. Fixed overbought/oversold levels carry no meaning as market volatility changes over time.
This indicator makes the extremes statistically rigorous: the bands adapt to the actual distribution of DPO values over the chosen lookback, so a breach always represents a genuinely unusual deviation regardless of the prevailing volatility regime.
The signal markers fire specifically on band re-entries, not on the initial breach, identifying the moment mean reversion has begun rather than flagging the extreme itself.
The six-layer glow rendering makes the oscillator's position relative to its bands immediately readable at a glance without requiring precise level inspection.
Disclaimer ⭕️
It is not financial advice, not an investment recommendation, and not affiliated with any financial institution, research firm, or organization of any kind. All content is provided for educational and informational purposes only. Always conduct your own research before making any financial decision.
Open-source Skript
Ganz im Sinne von TradingView hat dieser Autor sein/ihr Script als Open-Source veröffentlicht. Auf diese Weise können nun auch andere Trader das Script rezensieren und die Funktionalität überprüfen. Vielen Dank an den Autor! Sie können das Script kostenlos verwenden, aber eine Wiederveröffentlichung des Codes unterliegt unseren Hausregeln.

My premium indicators are available on Whop:
whop.com/astralvision
Astral Vision 🌠💠
whop.com/astralvision
Astral Vision 🌠💠
Haftungsausschluss
Die Informationen und Veröffentlichungen sind nicht als Finanz-, Anlage-, Handels- oder andere Arten von Ratschlägen oder Empfehlungen gedacht, die von TradingView bereitgestellt oder gebilligt werden, und stellen diese nicht dar. Lesen Sie mehr in den Nutzungsbedingungen.
Open-source Skript
Ganz im Sinne von TradingView hat dieser Autor sein/ihr Script als Open-Source veröffentlicht. Auf diese Weise können nun auch andere Trader das Script rezensieren und die Funktionalität überprüfen. Vielen Dank an den Autor! Sie können das Script kostenlos verwenden, aber eine Wiederveröffentlichung des Codes unterliegt unseren Hausregeln.
My premium indicators are available on Whop:
whop.com/astralvision
Astral Vision 🌠💠
whop.com/astralvision
Astral Vision 🌠💠
Haftungsausschluss
Die Informationen und Veröffentlichungen sind nicht als Finanz-, Anlage-, Handels- oder andere Arten von Ratschlägen oder Empfehlungen gedacht, die von TradingView bereitgestellt oder gebilligt werden, und stellen diese nicht dar. Lesen Sie mehr in den Nutzungsbedingungen.