Regime Compass [StrixEDGE]
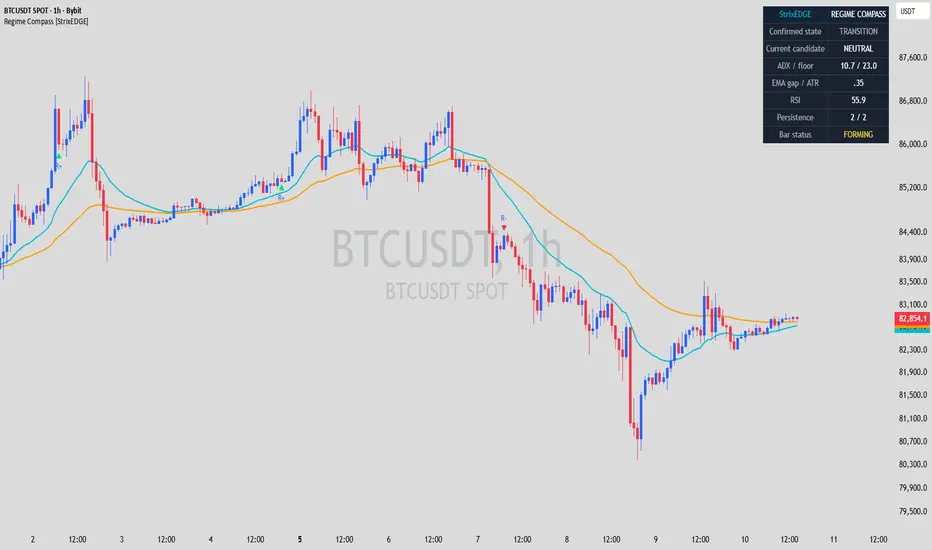
StrixEDGE - Regime Compass
01 · Purpose and analytical question
Classifies trending, compressing and transitional regimes using EMA slope, RSI, ADX and ATR-normalized separation with persistence. Use this study to classify market context before considering any trade, rather than treating a single oscillator or trend label as an execution instruction. The intended result is a readable analytical interpretation, not a claim about future prices, institutional intent, or guaranteed trade outcomes.
02 · Analytical framework
The concept combines Trend Indicators, Momentum Indicators, Volatility Indicators, Statistical & Quantitative. These components serve one defined workflow: Classifies trending, compressing and transitional regimes using EMA slope, RSI, ADX and ATR-normalized separation with persistence. For implementation, inputs, sampling windows, thresholds and the exact decision hierarchy must be disclosed and validated against both historical and developing bars. Bars and signals that require confirmation should be explicitly distinguished from provisional readings.
03 · StrixEDGE dashboard
The proposed compact dashboard organizes the most important observations without hiding the underlying price action:
Actual calculations and visual states must match the final audited code.
04 · Suggested workflow
1. Select the market and chart timeframe you are analysing.
2. Review the primary state together with its supporting measurements.
3. Compare the conclusion against independent structure and nearby price levels.
4. Recheck the result after the relevant bar closes; use any alerts as prompts for review, not orders.
05 · Alert specification
The following are planned, not certified working alerts:
Alert frequency and the meaning of a confirmed signal must be documented after TradingView testing. An alert does not constitute an order or a trading recommendation.
06 · What distinguishes the design
The intended contribution is a task-specific integration that Classifies trending, compressing and transitional regimes using EMA slope, RSI, ADX and ATR-normalized separation with persistence, with explicit context and diagnostic dashboard fields. Merely combining standard indicators is not sufficient originality; the implemented source and its value to users require an independent review before public release.
07 · Data, limitations and reliability
Data requirements: OHLCV. Primary limitation: Regime thresholds require calibration. Trend measures describe direction, not the certainty of continuation. Momentum readings can remain extreme while a trend persists. Volatility adapts with market conditions and is not inherently directional. Indicator values may depend on the exchange feed, session settings, available history, instrument liquidity and the selected timeframe. Test on appropriate chart types, avoid future data leakage and verify the behavior of higher-timeframe series, pivots and intrabar signals wherever relevant.
Educational and analytical use only. No return, win-rate, broker execution or non-repainting guarantee is asserted.
01 · Purpose and analytical question
Classifies trending, compressing and transitional regimes using EMA slope, RSI, ADX and ATR-normalized separation with persistence. Use this study to classify market context before considering any trade, rather than treating a single oscillator or trend label as an execution instruction. The intended result is a readable analytical interpretation, not a claim about future prices, institutional intent, or guaranteed trade outcomes.
02 · Analytical framework
The concept combines Trend Indicators, Momentum Indicators, Volatility Indicators, Statistical & Quantitative. These components serve one defined workflow: Classifies trending, compressing and transitional regimes using EMA slope, RSI, ADX and ATR-normalized separation with persistence. For implementation, inputs, sampling windows, thresholds and the exact decision hierarchy must be disclosed and validated against both historical and developing bars. Bars and signals that require confirmation should be explicitly distinguished from provisional readings.
03 · StrixEDGE dashboard
The proposed compact dashboard organizes the most important observations without hiding the underlying price action:
- Confirmed regime: a dedicated field in the proposed StrixEDGE information panel.
- Candidate regime: a dedicated field in the proposed StrixEDGE information panel.
- ADX: a dedicated field in the proposed StrixEDGE information panel.
- ATR gap: a dedicated field in the proposed StrixEDGE information panel.
- Data / bar status: visibility into missing inputs and whether a value is confirmed or still forming.
Actual calculations and visual states must match the final audited code.
04 · Suggested workflow
1. Select the market and chart timeframe you are analysing.
2. Review the primary state together with its supporting measurements.
3. Compare the conclusion against independent structure and nearby price levels.
4. Recheck the result after the relevant bar closes; use any alerts as prompts for review, not orders.
05 · Alert specification
The following are planned, not certified working alerts:
- Regime confirmed: a proposed event requiring a precise, independently tested trigger and clear bar-confirmation timing.
- Compression started: a proposed event requiring a precise, independently tested trigger and clear bar-confirmation timing.
Alert frequency and the meaning of a confirmed signal must be documented after TradingView testing. An alert does not constitute an order or a trading recommendation.
06 · What distinguishes the design
The intended contribution is a task-specific integration that Classifies trending, compressing and transitional regimes using EMA slope, RSI, ADX and ATR-normalized separation with persistence, with explicit context and diagnostic dashboard fields. Merely combining standard indicators is not sufficient originality; the implemented source and its value to users require an independent review before public release.
07 · Data, limitations and reliability
Data requirements: OHLCV. Primary limitation: Regime thresholds require calibration. Trend measures describe direction, not the certainty of continuation. Momentum readings can remain extreme while a trend persists. Volatility adapts with market conditions and is not inherently directional. Indicator values may depend on the exchange feed, session settings, available history, instrument liquidity and the selected timeframe. Test on appropriate chart types, avoid future data leakage and verify the behavior of higher-timeframe series, pivots and intrabar signals wherever relevant.
Educational and analytical use only. No return, win-rate, broker execution or non-repainting guarantee is asserted.

✅MY Free Signals Telegram
t.me/StrixEdge
✅Website
strix-edge.com
t.me/StrixEdge
✅Website
strix-edge.com
Haftungsausschluss
Die Informationen und Veröffentlichungen sind nicht als Finanz-, Anlage-, Handels- oder andere Arten von Ratschlägen oder Empfehlungen gedacht, die von TradingView bereitgestellt oder gebilligt werden, und stellen diese nicht dar. Lesen Sie mehr in den Nutzungsbedingungen.
✅MY Free Signals Telegram
t.me/StrixEdge
✅Website
strix-edge.com
t.me/StrixEdge
✅Website
strix-edge.com
Haftungsausschluss
Die Informationen und Veröffentlichungen sind nicht als Finanz-, Anlage-, Handels- oder andere Arten von Ratschlägen oder Empfehlungen gedacht, die von TradingView bereitgestellt oder gebilligt werden, und stellen diese nicht dar. Lesen Sie mehr in den Nutzungsbedingungen.