OPEN-SOURCE SCRIPT
Aktualisiert Cumulative Volume Delta
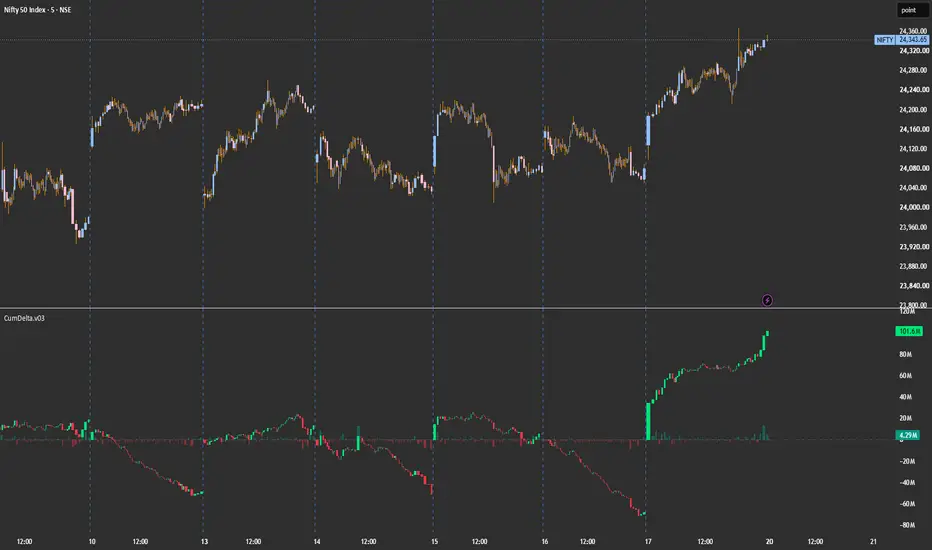
CumDelta — Cumulative Volume Delta with Session Reset
A clean cumulative volume delta (CVD) indicator that visualizes the running balance of buying vs. selling aggression using lower-timeframe up/down volume. Designed for intraday traders who want to read order flow alongside price.
What it does
Each bar's delta is calculated by pulling lower-timeframe volume data and classifying it as buying or selling pressure based on whether each sub-bar closed up or down. These per-bar deltas are then cumulated into a running total that resets on your chosen schedule (day, session, week, month, year, or N bars back).
The cumulative delta is rendered as candles — each candle's open chains from the previous close, and the body shows whether net flow on that bar was positive or negative. A histogram below shows the raw per-bar delta for quick reference.
How to read it
Rising green candles — sustained buying pressure
Falling red candles — sustained selling pressure
Divergence vs. price — price makes a new high but CVD doesn't (or vice versa) often precedes reversals
Reset bars (optional yellow highlight) — fresh session start, useful for marking where the cumulation restarts
Settings
Reset Period — Day, Session (RTH-aware), Week, Month, Year, or Bars Back
Lower Timeframe — auto-selects based on chart TF, or set manually for finer/coarser resolution
Doji Handling — choose how to attribute volume when a bar closes flat (Split 50/50, Up, Down, or Skip)
Display toggles — bar delta histogram, cumulative candles, reset markers
A clean cumulative volume delta (CVD) indicator that visualizes the running balance of buying vs. selling aggression using lower-timeframe up/down volume. Designed for intraday traders who want to read order flow alongside price.
What it does
Each bar's delta is calculated by pulling lower-timeframe volume data and classifying it as buying or selling pressure based on whether each sub-bar closed up or down. These per-bar deltas are then cumulated into a running total that resets on your chosen schedule (day, session, week, month, year, or N bars back).
The cumulative delta is rendered as candles — each candle's open chains from the previous close, and the body shows whether net flow on that bar was positive or negative. A histogram below shows the raw per-bar delta for quick reference.
How to read it
Rising green candles — sustained buying pressure
Falling red candles — sustained selling pressure
Divergence vs. price — price makes a new high but CVD doesn't (or vice versa) often precedes reversals
Reset bars (optional yellow highlight) — fresh session start, useful for marking where the cumulation restarts
Settings
Reset Period — Day, Session (RTH-aware), Week, Month, Year, or Bars Back
Lower Timeframe — auto-selects based on chart TF, or set manually for finer/coarser resolution
Doji Handling — choose how to attribute volume when a bar closes flat (Split 50/50, Up, Down, or Skip)
Display toggles — bar delta histogram, cumulative candles, reset markers
Versionshinweise
-Bug FixOpen-source Skript
Ganz im Sinne von TradingView hat dieser Autor sein/ihr Script als Open-Source veröffentlicht. Auf diese Weise können nun auch andere Trader das Script rezensieren und die Funktionalität überprüfen. Vielen Dank an den Autor! Sie können das Script kostenlos verwenden, aber eine Wiederveröffentlichung des Codes unterliegt unseren Hausregeln.

Haftungsausschluss
Die Informationen und Veröffentlichungen sind nicht als Finanz-, Anlage-, Handels- oder andere Arten von Ratschlägen oder Empfehlungen gedacht, die von TradingView bereitgestellt oder gebilligt werden, und stellen diese nicht dar. Lesen Sie mehr in den Nutzungsbedingungen.
Open-source Skript
Ganz im Sinne von TradingView hat dieser Autor sein/ihr Script als Open-Source veröffentlicht. Auf diese Weise können nun auch andere Trader das Script rezensieren und die Funktionalität überprüfen. Vielen Dank an den Autor! Sie können das Script kostenlos verwenden, aber eine Wiederveröffentlichung des Codes unterliegt unseren Hausregeln.
Haftungsausschluss
Die Informationen und Veröffentlichungen sind nicht als Finanz-, Anlage-, Handels- oder andere Arten von Ratschlägen oder Empfehlungen gedacht, die von TradingView bereitgestellt oder gebilligt werden, und stellen diese nicht dar. Lesen Sie mehr in den Nutzungsbedingungen.