Aktualisiert
[blackcat] L1 Dynamic Multi-Layer Bollinger Bands
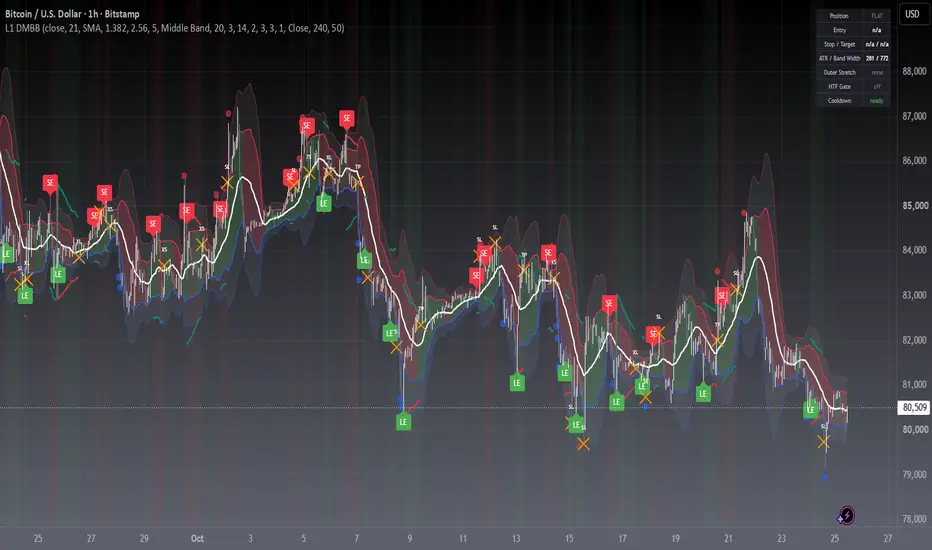
## Overview
The L1 Dynamic Multi-Layer Bollinger Bands script is a custom indicator designed to provide a comprehensive analysis of price movements using Bollinger Bands, a widely-used technical analysis tool. The Bollinger Bands consist of a middle band being a simple moving average (SMA) of the close price, and an upper and lower band that are respectively 1.382 and 2.56 times the standard deviation of the close price over a 21-day period.
## How to Use
1. **Add the Indicator to Your Chart**: Click on the "Add to Chart" button in the Pine-Script editor. This will add the L1 Dynamic Multi-Layer Bollinger Bands to your chart.
2. **Interpreting the Bands**: The Bollinger Bands are plotted on your chart. The middle band is the 21-day SMA of the close price. The upper band is 1.382 times the standard deviation above the middle band, and the lower band is 1.382 times the standard deviation below the middle band.
3. **Analyzing the Bands**: When the price moves above the upper band, it is considered an overbought condition. When the price moves below the lower band, it is considered an oversold condition. These are potential areas of support and resistance.
4. **Multi-Layer Structure**: The script also calculates two additional bands, `up2` and `loow2`, which are respectively 2.56 times the standard deviation above and below the middle band. These bands provide a more layered perspective on the volatility of the price.
5. **Color Coding**: The area between the upper and lower bands is filled with a color that indicates the direction of the price movement. Green indicates an upward trend, and red indicates a downward trend.
## Disclaimer
The information provided by this script is for educational purposes only and should not be used as the sole basis for any trading decisions. Trading involves risk, and it is possible to lose money when trading stocks and other financial instruments. Use this script at your own risk.
The L1 Dynamic Multi-Layer Bollinger Bands script is a custom indicator designed to provide a comprehensive analysis of price movements using Bollinger Bands, a widely-used technical analysis tool. The Bollinger Bands consist of a middle band being a simple moving average (SMA) of the close price, and an upper and lower band that are respectively 1.382 and 2.56 times the standard deviation of the close price over a 21-day period.
## How to Use
1. **Add the Indicator to Your Chart**: Click on the "Add to Chart" button in the Pine-Script editor. This will add the L1 Dynamic Multi-Layer Bollinger Bands to your chart.
2. **Interpreting the Bands**: The Bollinger Bands are plotted on your chart. The middle band is the 21-day SMA of the close price. The upper band is 1.382 times the standard deviation above the middle band, and the lower band is 1.382 times the standard deviation below the middle band.
3. **Analyzing the Bands**: When the price moves above the upper band, it is considered an overbought condition. When the price moves below the lower band, it is considered an oversold condition. These are potential areas of support and resistance.
4. **Multi-Layer Structure**: The script also calculates two additional bands, `up2` and `loow2`, which are respectively 2.56 times the standard deviation above and below the middle band. These bands provide a more layered perspective on the volatility of the price.
5. **Color Coding**: The area between the upper and lower bands is filled with a color that indicates the direction of the price movement. Green indicates an upward trend, and red indicates a downward trend.
## Disclaimer
The information provided by this script is for educational purposes only and should not be used as the sole basis for any trading decisions. Trading involves risk, and it is possible to lose money when trading stocks and other financial instruments. Use this script at your own risk.
Versionshinweise
OVERVIEWThe [blackcat] L1 Dynamic Multi-Layer Bollinger Bands indicator enhances traditional Bollinger Bands by adding multiple layers of volatility measurement. This script calculates both inner and outer bands around a central moving average, providing traders with a more comprehensive view of market volatility and potential reversal points. With clear visual cues and alert capabilities, it aids in identifying optimal entry and exit points 📉↗️.
FEATURES
Calculates Dynamic Multi-Layer Bollinger Bands:
Middle Band: Simple Moving Average (SMA) of the closing prices.
Inner Bands: Upper and Lower Bands based on the first multiplier.
Outer Bands: Additional Upper and Lower Bands based on the second multiplier.
Plots five key lines on the chart:
White line representing the Middle Band.
Green or Red shaded areas between the Inner Bands.
Red lines for the Upper Bands.
Blue lines for the Lower Bands.
Displays buy ('BUY') and sell ('SELL') labels on the chart for quick identification 🏷️
Generates alerts when price crosses the inner bands 🔔
HOW TO USE
Add the indicator to your TradingView chart by selecting it from the indicators list.
Observe the plotted bands and their interactions with the price action.
Look for buy signals when the price crosses below the lower inner band.
Look for sell signals when the price crosses above the upper inner band.
Set up alerts based on the generated signals to receive notifications when conditions are met 📲.
Use the outer bands as additional context for understanding market volatility.
LIMITATIONS
The indicator may generate false signals in highly volatile or ranging markets 🌪️.
Users should combine this indicator with other forms of analysis for more reliable trading decisions.
The effectiveness of the indicator may vary depending on the asset and timeframe being analyzed.
NOTES
Ensure that you have sufficient historical data available for accurate calculations.
Test the indicator thoroughly on demo accounts before applying it to live trading 🔍.
Customize the appearance and parameters as needed to fit your trading strategy.
Versionshinweise
█ OVERVIEWL1 DMBB draws a two-layer Bollinger envelope — an inner band pair plus an outer
band pair — and turns it into a complete mean-reversion trading system: paired
long and short entries, three selectable exit mechanisms, ATR stop-loss and
take-profit levels, a status dashboard and six alert channels.
The outer layer is not decoration: entries can be gated so a fade is only taken
after price has actually stretched beyond the outer band.
█ CONCEPTS
• Two-layer envelope: inner pair at the Inner Multiplier and outer pair at the
Outer Multiplier, around a selectable middle band (SMA / EMA / RMA / WMA).
• Stretch gate: a fade entry requires a recent touch of the outer band, so the
signal fires on exhaustion rather than on any band cross.
• Signal governance: a position state machine, same-bar entry / exit
arbitration and a cooldown keep signals mutually exclusive and non-repeating.
• Risk map: ATR multiples define stop-loss and take-profit lines that follow
the open trade, with an optional chandelier trailing stop.
█ HOW TO USE
1 — Add the indicator to any chart. The defaults (21, 1.382, 2.56) reproduce the
original L1 band geometry.
2 — Read the envelope: the inner fill turns green / red with middle-band slope,
and small circles mark bars closing outside the outer bands.
3 — Read entries: LE (green, below bar) is a long fade from the lower band;
SE (red, above bar) is a short fade from the upper band.
4 — Read exits: orange XL / XS crosses are signal exits, SL and TP mark the ATR
protective exits, TIME marks the maximum holding time.
5 — Alerts: create alerts on the six alertcondition channels, or use the dynamic
alert message, which already carries ticker, direction, reason and price.
Key inputs
• Bands: Source, Band Period, Middle Band MA, Inner / Outer Multiplier
• Signals: Enable Short Signals, Require Outer-Band Stretch, Stretch Lookback,
Exit Trigger, Max Bars In Trade
• Governance: Same-bar Entry / Exit Exclusivity, Cooldown Bars
• Risk: ATR Length, Stop Loss (xATR), Take Profit (xATR), Chandelier Trailing
• Optional: Re-entry RL / RS, HTF Direction Gate
• Visual: zone fills, position background, dashboard, TP / SL lines, touch marks
█ FEATURES
• Bidirectional signals with one short-side switch
• Three exit mechanisms: middle-band cross, maximum holding time, opposite signal
• ATR stop and target lines, plus an optional chandelier trailing stop
• Optional re-entry anchored on the exit-bar extremes (RL / RS)
• Optional higher-timeframe direction gate that never repaints
• Position background tint, status dashboard, position state in the data window
• Six alertcondition channels plus one close-confirmed dynamic alert
█ SIGNALS
• LE — long entry: close crossing back up through the inner lower band
• SE — short entry: close crossing back down through the inner upper band
• XL / XS — signal exit of a long / short position
• SL / TP — protective exit at the ATR stop or the ATR target
• TIME — exit forced by Max Bars In Trade
• RL / RS — re-entry after an exit when the anchored extreme breaks
• Blue / red circles — close outside the outer band (stretch state)
█ IMPLEMENTATION NOTES
Built on ta.sma / ta.ema / ta.rma / ta.wma, ta.stdev, ta.crossover,
ta.crossunder, ta.atr, ta.lowest and ta.highest. The higher-timeframe gate reads
the last closed HTF bar with request.security(..., close[1],
barmerge.lookahead_on), so it does not repaint. Signals are evaluated on the
current bar close — set alerts to Once Per Bar Close.
█ LIMITATIONS
• Mean-reversion logic: expect weaker behaviour in strong one-way trends
• Bar-close based: intrabar flicker is possible before the bar confirms
• The stretch gate lowers signal count — switch it off for the raw band cross
• Re-entry and the HTF gate are off by default and change signal frequency
• This is an indicator, not a backtest: no orders are placed or simulated
█ NOTES
• V2 rebuild of the original L1 DMBB: same bands, new signal and risk layer
• Mozilla Public License 2.0 — free to use and modify, attribution appreciated
═════════════════════════════════════════════════════════════════════════
For questions or feedback, use the comments section below.

Don't miss out! The first and most important thing to do is to join my Discord chat now! Click here to start your adventure: discord.com/invite/ZTGpQJq My new github for more pine development soon: github.com/wxt-coder
Haftungsausschluss
Die Informationen und Veröffentlichungen sind nicht als Finanz-, Anlage-, Handels- oder andere Arten von Ratschlägen oder Empfehlungen gedacht, die von TradingView bereitgestellt oder gebilligt werden, und stellen diese nicht dar. Lesen Sie mehr in den Nutzungsbedingungen.
Don't miss out! The first and most important thing to do is to join my Discord chat now! Click here to start your adventure: discord.com/invite/ZTGpQJq My new github for more pine development soon: github.com/wxt-coder
Haftungsausschluss
Die Informationen und Veröffentlichungen sind nicht als Finanz-, Anlage-, Handels- oder andere Arten von Ratschlägen oder Empfehlungen gedacht, die von TradingView bereitgestellt oder gebilligt werden, und stellen diese nicht dar. Lesen Sie mehr in den Nutzungsbedingungen.