Intrinsic Trend Anatomy [Harmony Algo]
Is price making an ordinary pullback, spending unusually much movement without recovering, or confirming a change in structure? Intrinsic Trend Anatomy separates these situations with event-based price analysis and a memory of completed pullbacks. It is a chart-reading tool, not an automatic entry/exit system.
READ THE CHART
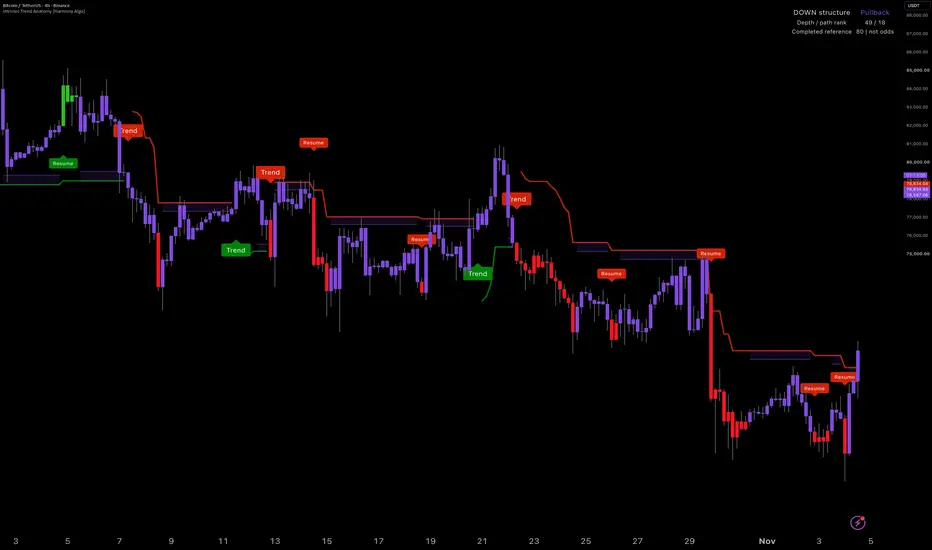
Green and red candles indicate aligned upward and downward structure. Purple indicates an active pullback or disagreement between the structure and broad event scales; it does not automatically mean a sideways market. The brighter default directional shade means the micro scale also agrees. Gray is initialization.
The thin green/red line is the structure clock's reversal boundary. A close through it confirms a new direction under this model. It is not a recommended stop-loss.
During a pullback, a local purple corridor shows the historical-depth reference and the structure edge. The inner edge is the 70th percentile of completed pullback depths, constrained to 20–90% of the frozen structure distance so the corridor stays inside that distance. It is an attention area, not a support/resistance forecast.
Trend marks a newly confirmed structure direction, including its initial establishment. Resume means price has recovered the pullback's starting extreme on a closing basis. Stress marks the first historically unusual reading within that pullback. These labels identify model events; none is a promised profitable trade. Labels are placed on the bar where the event becomes known, without backdating to a prior high or low. The most recent 150 event labels are retained.
THE ENGINE
Three directional-change clocks follow closing prices at micro, structure and broad movement scales. Unlike a fixed bar-count oscillator, a new directional event requires price to reverse a defined distance from the running closing extreme. The event-based viewpoint is informed by the intrinsic-time literature, including James B. Glattfelder and Richard B. Olsen's The Theory of Intrinsic Time: A Primer (2024). This script is an original implementation, not a reproduction of that paper's full framework.
The structure distance starts from log(1 + multiplier × prior-bar ATR / prior close). It is frozen when each direction begins; the micro and broad clocks use scaled distances and freeze independently. Volatility therefore cannot widen an already active clock's reversal threshold. Thresholds can nevertheless differ between consecutive directions.
A pullback begins after the countertrend closing displacement reaches 20% of the frozen structure distance. The tool then measures:
• Depth: the largest countertrend log-price displacement, divided by the excursion's frozen structure distance.
• Path: the cumulative absolute close-to-close log movement from the trigger bar through the excursion, divided by that same distance. This is traversed price movement, not volume, order flow, money spent or elapsed time.
The excursion ends when its anchor is recovered or structure reverses. Both recovered and structure-flip excursions enter the rolling reference library, preventing a library made only of successful recoveries. Gap moves can exceed a normalized depth of one. Upward and downward cases are pooled after direction normalization; the model does not assume they have identical future behavior.
At each pullback's start, the tool snapshots the completed-excursion library. That reference stays fixed until the pullback ends, and the unfinished pullback never trains its own comparison. Depth/path ranks are empirical midranks against completed maximum depths and total paths. A rank of 80 means the current measurement ranks around the 80th percentile of that reference. It does NOT mean an 80% chance of reversal or recovery. Unfinished measurements are being compared with completed excursions, an important interpretation limit.
Stress is a descriptive heuristic: depth rank reaches 80, or depth rank reaches 50 while path rank reaches 90. It fires once per excursion, only when the minimum reference count is available. It can be rare, and a reversal can happen without a Stress event.
WHY DEPTH AND PATH?
Two pullbacks can reach similar depths while traveling very different cumulative distances. The path rank adds a view of repeated countertrend/return movement that a single trailing boundary cannot express. The distinguishing implementation is the combination of independently frozen event scales, a two-axis completed-excursion memory, and reference snapshots taken before each comparison. This descriptive addition is not evidence of predictive or trading superiority.
USE AND SETTINGS
Start with standard candles and the defaults. Read structure direction first, then the pullback state and ranks. Resume requires full anchor recovery and can occur late. Mixed scales can persist, and the structure clock can whipsaw in ranges.
Volatility reference controls ATR estimation. Structure distance changes the event size; larger values generally produce fewer directional changes. Micro/structure and broad/structure ratios control the scale separation. Completed excursions retained sets the rolling memory, and Minimum reference samples controls the learning period. Default memory is 80 and the minimum is 12. Before sufficient samples exist, historical ranks, Stress events and the learned corridor are withheld. Event labels, candle coloring, boundary, corridor and compact status can be switched off separately. More diagnostic counts appear in the Data Window; these count excursions, not trades or win rate.
TIMING, ALERTS AND LIMITS
All clock and excursion decisions run on confirmed candle closes. Five alert conditions use the same booleans as the corresponding labels: Up structure confirmed, Down structure confirmed, Up pullback recovered, Down pullback recovered, and Unusual pullback. Select the indicator and the required named condition in Create Alert, and use Once Per Bar Close for repeated monitoring. Turning off visual labels does not disable their alert conditions. Existing alerts must be recreated after changing script settings or code.
TradingView displayed its repaint caution in the alert dialog during testing. It has not been suppressed. The implementation does not request other timeframes, use lookahead, move event labels into the past, or update model state intrabar. Closed-bar consistency checks are limited checks, not a universal non-repainting guarantee. Data-feed revisions, a different loaded-history starting point, symbol/timeframe changes or altered settings can change historical calculations. Live notification delivery was not tested.
Use on positive-price standard charts with valid ATR history. The tool skips bars with invalid required prices/volatility. Wick-only reversals do not count. A frozen scale can become less appropriate after a volatility shock; rolling reference samples are not stationary, and the minimum sample count does not establish statistical reliability. No profitability backtest or calibrated forecasting claim is supplied. This is a descriptive analysis overlay, not a complete trading strategy.
READ THE CHART
Green and red candles indicate aligned upward and downward structure. Purple indicates an active pullback or disagreement between the structure and broad event scales; it does not automatically mean a sideways market. The brighter default directional shade means the micro scale also agrees. Gray is initialization.
The thin green/red line is the structure clock's reversal boundary. A close through it confirms a new direction under this model. It is not a recommended stop-loss.
During a pullback, a local purple corridor shows the historical-depth reference and the structure edge. The inner edge is the 70th percentile of completed pullback depths, constrained to 20–90% of the frozen structure distance so the corridor stays inside that distance. It is an attention area, not a support/resistance forecast.
Trend marks a newly confirmed structure direction, including its initial establishment. Resume means price has recovered the pullback's starting extreme on a closing basis. Stress marks the first historically unusual reading within that pullback. These labels identify model events; none is a promised profitable trade. Labels are placed on the bar where the event becomes known, without backdating to a prior high or low. The most recent 150 event labels are retained.
THE ENGINE
Three directional-change clocks follow closing prices at micro, structure and broad movement scales. Unlike a fixed bar-count oscillator, a new directional event requires price to reverse a defined distance from the running closing extreme. The event-based viewpoint is informed by the intrinsic-time literature, including James B. Glattfelder and Richard B. Olsen's The Theory of Intrinsic Time: A Primer (2024). This script is an original implementation, not a reproduction of that paper's full framework.
The structure distance starts from log(1 + multiplier × prior-bar ATR / prior close). It is frozen when each direction begins; the micro and broad clocks use scaled distances and freeze independently. Volatility therefore cannot widen an already active clock's reversal threshold. Thresholds can nevertheless differ between consecutive directions.
A pullback begins after the countertrend closing displacement reaches 20% of the frozen structure distance. The tool then measures:
• Depth: the largest countertrend log-price displacement, divided by the excursion's frozen structure distance.
• Path: the cumulative absolute close-to-close log movement from the trigger bar through the excursion, divided by that same distance. This is traversed price movement, not volume, order flow, money spent or elapsed time.
The excursion ends when its anchor is recovered or structure reverses. Both recovered and structure-flip excursions enter the rolling reference library, preventing a library made only of successful recoveries. Gap moves can exceed a normalized depth of one. Upward and downward cases are pooled after direction normalization; the model does not assume they have identical future behavior.
At each pullback's start, the tool snapshots the completed-excursion library. That reference stays fixed until the pullback ends, and the unfinished pullback never trains its own comparison. Depth/path ranks are empirical midranks against completed maximum depths and total paths. A rank of 80 means the current measurement ranks around the 80th percentile of that reference. It does NOT mean an 80% chance of reversal or recovery. Unfinished measurements are being compared with completed excursions, an important interpretation limit.
Stress is a descriptive heuristic: depth rank reaches 80, or depth rank reaches 50 while path rank reaches 90. It fires once per excursion, only when the minimum reference count is available. It can be rare, and a reversal can happen without a Stress event.
WHY DEPTH AND PATH?
Two pullbacks can reach similar depths while traveling very different cumulative distances. The path rank adds a view of repeated countertrend/return movement that a single trailing boundary cannot express. The distinguishing implementation is the combination of independently frozen event scales, a two-axis completed-excursion memory, and reference snapshots taken before each comparison. This descriptive addition is not evidence of predictive or trading superiority.
USE AND SETTINGS
Start with standard candles and the defaults. Read structure direction first, then the pullback state and ranks. Resume requires full anchor recovery and can occur late. Mixed scales can persist, and the structure clock can whipsaw in ranges.
Volatility reference controls ATR estimation. Structure distance changes the event size; larger values generally produce fewer directional changes. Micro/structure and broad/structure ratios control the scale separation. Completed excursions retained sets the rolling memory, and Minimum reference samples controls the learning period. Default memory is 80 and the minimum is 12. Before sufficient samples exist, historical ranks, Stress events and the learned corridor are withheld. Event labels, candle coloring, boundary, corridor and compact status can be switched off separately. More diagnostic counts appear in the Data Window; these count excursions, not trades or win rate.
TIMING, ALERTS AND LIMITS
All clock and excursion decisions run on confirmed candle closes. Five alert conditions use the same booleans as the corresponding labels: Up structure confirmed, Down structure confirmed, Up pullback recovered, Down pullback recovered, and Unusual pullback. Select the indicator and the required named condition in Create Alert, and use Once Per Bar Close for repeated monitoring. Turning off visual labels does not disable their alert conditions. Existing alerts must be recreated after changing script settings or code.
TradingView displayed its repaint caution in the alert dialog during testing. It has not been suppressed. The implementation does not request other timeframes, use lookahead, move event labels into the past, or update model state intrabar. Closed-bar consistency checks are limited checks, not a universal non-repainting guarantee. Data-feed revisions, a different loaded-history starting point, symbol/timeframe changes or altered settings can change historical calculations. Live notification delivery was not tested.
Use on positive-price standard charts with valid ATR history. The tool skips bars with invalid required prices/volatility. Wick-only reversals do not count. A frozen scale can become less appropriate after a volatility shock; rolling reference samples are not stationary, and the minimum sample count does not establish statistical reliability. No profitability backtest or calibrated forecasting claim is supplied. This is a descriptive analysis overlay, not a complete trading strategy.

Elevate Your Trading ▶ qalphatrade.com
Trade with mathematical certainty,
not emotional guesswork.
Trade with mathematical certainty,
not emotional guesswork.
Haftungsausschluss
Die Informationen und Veröffentlichungen sind nicht als Finanz-, Anlage-, Handels- oder andere Arten von Ratschlägen oder Empfehlungen gedacht, die von TradingView bereitgestellt oder gebilligt werden, und stellen diese nicht dar. Lesen Sie mehr in den Nutzungsbedingungen.
Elevate Your Trading ▶ qalphatrade.com
Trade with mathematical certainty,
not emotional guesswork.
Trade with mathematical certainty,
not emotional guesswork.
Haftungsausschluss
Die Informationen und Veröffentlichungen sind nicht als Finanz-, Anlage-, Handels- oder andere Arten von Ratschlägen oder Empfehlungen gedacht, die von TradingView bereitgestellt oder gebilligt werden, und stellen diese nicht dar. Lesen Sie mehr in den Nutzungsbedingungen.