Aktualisiert
SBP Value Momentum Navigator
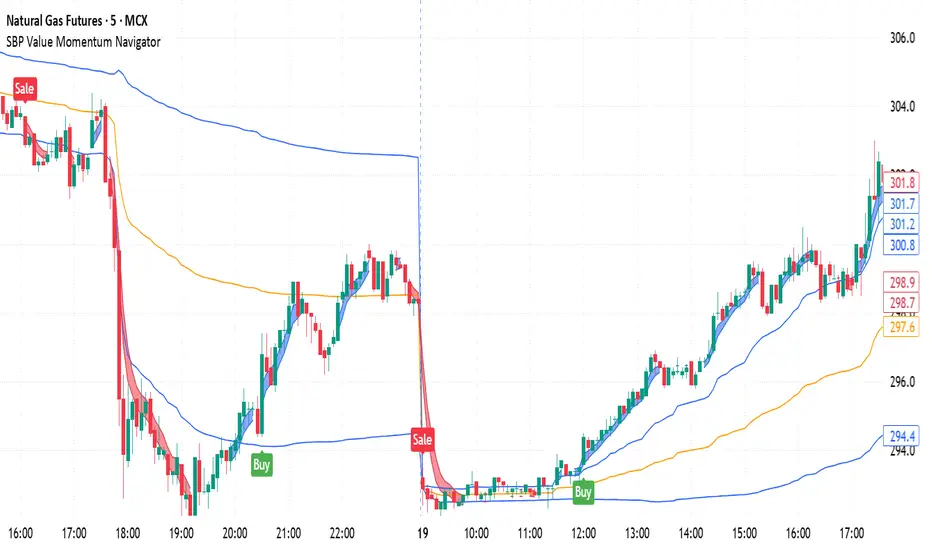
SBP Value Momentum Navigator
SBP Value Momentum Navigator is a chart overlay that identifies confirmed price acceptance outside daily VWAP deviation bands, supported by RSI momentum. It combines a defined Buy/Sale sequence with optional volume-profile structure, a session histogram and directional clouds.
The components serve different purposes within the same analytical workflow. VWAP bands establish price location, RSI qualifies momentum, and a persistent direction state prevents repeated same-direction labels. The profile and clouds help users examine the conditions surrounding a signal. Their visibility and settings do not alter the Buy/Sale qualification rules.
Signal methodology
The script calculates daily anchored VWAP using typical price—the average of each candle’s high, low and close—and constructs bands one standard deviation above and below it.
A Buy qualifies when a confirmed candle closes strictly above the upper band and RSI is equal to or greater than the configured Buy threshold. The default RSI length is 14, with a Buy threshold of 60.
A Sale qualifies when a confirmed candle closes strictly below the lower band and RSI is equal to or below the configured Sale threshold. The default Sale threshold is 45.
These are acceptance conditions, so the signal candle does not have to make a fresh band crossing. Price may already be outside a band when RSI first satisfies its requirement. The qualifying label appears when that candle closes.
The engine does not impose additional candle-colour, cloud-direction or profile-location requirements. This keeps the entry conditions transparent: labels depend on daily VWAP deviation, RSI qualification and alternation.
One Buy and one Sale
After a Buy, another Buy is suppressed until a Sale qualifies. After a Sale, another Sale is suppressed until a Buy qualifies.
This direction memory continues across trading sessions. Daily VWAP and the profile retain their own reset rules, while the label sequence remains active. A new trading day does not automatically produce a label or reset the previous signal direction.
Signals require confirmed standard candles and use zero backward offset. Hiding labels changes their visibility without stopping the calculations. The script does not execute trades, track brokerage positions or calculate strategy returns.
Developing volume structure
The session profile estimates volume distribution across price rows. Each sampled candle’s reported volume is allocated proportionally across the rows intersected by its high–low range.
Sampling can use chart candles or available lower-timeframe candles. Auto selects a resolution according to chart timeframe and instrument type. When suitable intrabar samples are unavailable, the profile can fall back to chart-candle information.
The default configuration uses 24 target rows and a 70% value-area target. The highest-volume row determines Volume Control, or POC. Expansion around that row produces the core upper and lower boundaries. Optional outer boundaries use a 94% target.
Coverage is approximate because row granularity and the expansion convention affect the achieved percentage. This is an estimate derived from candles, rather than exchange-level volume-at-price, bid/ask delta or order-book data.
Optional horizontal lines display current developing structure. A separate POC trail records confirmed changes during the current session. All structure lines, including that trail, are off by default.
Session histogram and clouds
The optional session histogram displays the estimated profile as horizontal rows beginning at the session’s start. Row widths represent relative volume, while colours distinguish their positions within the developing structure. Its width and transparency are adjustable. The histogram is off by default.
Bull and bear clouds summarise short-term directional alignment using price relationships, estimated participation and movement. Their calculations consider a volume-weighted reference, a fallback price average where required, candle close-location pressure and short-term trend relationships.
Clouds provide context rather than permission to trade. A cloud can disagree with a Buy or Sale label because its calculation serves a different purpose. Hiding the clouds does not alter signal generation.
The smooth VWAP channel has been removed. The remaining VWAP and ±1 standard-deviation lines are the references used by the signal engine.
Settings and interpretation
Visual controls are organised in Inputs, with editable Style properties restricted to reduce duplicated controls. Configurable line widths default to 1. RSI is available in the Data Window.
Users can examine whether a qualifying label occurs near concentrated volume, outside the developing value area or alongside directional cloud alignment. These observations support discretionary analysis without introducing hidden entry conditions.
Developing profile levels can move as the session progresses. Their final horizontal positions should not be interpreted as levels that were available throughout the session.
Results depend on timeframe, reported volume, sampling availability and the configured 1,500-bar calculation history. The indicator provides rule-based observations, not guaranteed reversals or profitability forecasts. Position sizing, risk limits and trade management require separate consideration
SBP Value Momentum Navigator is a chart overlay that identifies confirmed price acceptance outside daily VWAP deviation bands, supported by RSI momentum. It combines a defined Buy/Sale sequence with optional volume-profile structure, a session histogram and directional clouds.
The components serve different purposes within the same analytical workflow. VWAP bands establish price location, RSI qualifies momentum, and a persistent direction state prevents repeated same-direction labels. The profile and clouds help users examine the conditions surrounding a signal. Their visibility and settings do not alter the Buy/Sale qualification rules.
Signal methodology
The script calculates daily anchored VWAP using typical price—the average of each candle’s high, low and close—and constructs bands one standard deviation above and below it.
A Buy qualifies when a confirmed candle closes strictly above the upper band and RSI is equal to or greater than the configured Buy threshold. The default RSI length is 14, with a Buy threshold of 60.
A Sale qualifies when a confirmed candle closes strictly below the lower band and RSI is equal to or below the configured Sale threshold. The default Sale threshold is 45.
These are acceptance conditions, so the signal candle does not have to make a fresh band crossing. Price may already be outside a band when RSI first satisfies its requirement. The qualifying label appears when that candle closes.
The engine does not impose additional candle-colour, cloud-direction or profile-location requirements. This keeps the entry conditions transparent: labels depend on daily VWAP deviation, RSI qualification and alternation.
One Buy and one Sale
After a Buy, another Buy is suppressed until a Sale qualifies. After a Sale, another Sale is suppressed until a Buy qualifies.
This direction memory continues across trading sessions. Daily VWAP and the profile retain their own reset rules, while the label sequence remains active. A new trading day does not automatically produce a label or reset the previous signal direction.
Signals require confirmed standard candles and use zero backward offset. Hiding labels changes their visibility without stopping the calculations. The script does not execute trades, track brokerage positions or calculate strategy returns.
Developing volume structure
The session profile estimates volume distribution across price rows. Each sampled candle’s reported volume is allocated proportionally across the rows intersected by its high–low range.
Sampling can use chart candles or available lower-timeframe candles. Auto selects a resolution according to chart timeframe and instrument type. When suitable intrabar samples are unavailable, the profile can fall back to chart-candle information.
The default configuration uses 24 target rows and a 70% value-area target. The highest-volume row determines Volume Control, or POC. Expansion around that row produces the core upper and lower boundaries. Optional outer boundaries use a 94% target.
Coverage is approximate because row granularity and the expansion convention affect the achieved percentage. This is an estimate derived from candles, rather than exchange-level volume-at-price, bid/ask delta or order-book data.
Optional horizontal lines display current developing structure. A separate POC trail records confirmed changes during the current session. All structure lines, including that trail, are off by default.
Session histogram and clouds
The optional session histogram displays the estimated profile as horizontal rows beginning at the session’s start. Row widths represent relative volume, while colours distinguish their positions within the developing structure. Its width and transparency are adjustable. The histogram is off by default.
Bull and bear clouds summarise short-term directional alignment using price relationships, estimated participation and movement. Their calculations consider a volume-weighted reference, a fallback price average where required, candle close-location pressure and short-term trend relationships.
Clouds provide context rather than permission to trade. A cloud can disagree with a Buy or Sale label because its calculation serves a different purpose. Hiding the clouds does not alter signal generation.
The smooth VWAP channel has been removed. The remaining VWAP and ±1 standard-deviation lines are the references used by the signal engine.
Settings and interpretation
Visual controls are organised in Inputs, with editable Style properties restricted to reduce duplicated controls. Configurable line widths default to 1. RSI is available in the Data Window.
Users can examine whether a qualifying label occurs near concentrated volume, outside the developing value area or alongside directional cloud alignment. These observations support discretionary analysis without introducing hidden entry conditions.
Developing profile levels can move as the session progresses. Their final horizontal positions should not be interpreted as levels that were available throughout the session.
Results depend on timeframe, reported volume, sampling availability and the configured 1,500-bar calculation history. The indicator provides rule-based observations, not guaranteed reversals or profitability forecasts. Position sizing, risk limits and trade management require separate consideration
Versionshinweise
SBP Value Momentum Navigator is a chart overlay that identifies confirmed momentum conditions outside daily VWAP deviation bands and allows fresh signals after a price pullback. It also displays directional clouds and an optional developing volume profile to help users examine the context surrounding each signal.The indicator’s workflow connects three observations: price extension relative to daily VWAP, momentum qualification through RSI, and the location of that movement relative to estimated volume concentration. The signal engine uses VWAP and RSI directly. Clouds, profile boundaries and the histogram provide additional visual information without changing signal eligibility.
Daily VWAP and momentum qualification
The script calculates VWAP using typical price, which is the average of each candle’s high, low and close, weighted by reported volume. VWAP resets when the script detects a new daily period. Upper and lower bands are positioned one standard deviation above and below VWAP.
A Buy signal requires a confirmed candle to close strictly above the upper band while RSI meets or exceeds the selected Buy threshold. Default settings use a 14-period RSI and a Buy threshold of 60.
A Sale signal requires a confirmed candle to close strictly below the lower band while RSI is at or below the selected Sale threshold. The default Sale threshold is 45.
A candle closing exactly on a band does not qualify for a signal. Candle colour is not part of the acceptance conditions.
Pullback-based signal renewal
The script prints one signal during an uninterrupted qualifying move rather than repeating a label on every qualifying candle.
After a Buy, additional Buy signals remain blocked until a confirmed candle closes at or below the upper VWAP band. This close establishes the pullback reset. A subsequent candle can produce another Buy when it closes above the upper band and satisfies the RSI requirement.
After a Sale, additional Sale signals remain blocked until a confirmed candle closes at or above the lower VWAP band. A subsequent close below that band can produce another Sale when RSI also qualifies.
An opposite signal is not required before a fresh same-direction signal. RSI fluctuations alone do not reset eligibility while price remains outside the relevant band. A wick touching the band also does not reset eligibility unless the candle closes at or inside it. Daily VWAP resets do not independently clear the signal lock.
This approach distinguishes a sustained extension from a renewed move following a confirmed return toward the daily reference.
Developing volume structure
The profile estimates the current daily period’s volume distribution by allocating sampled candle volume across the price rows intersected by each candle’s high–low range. Allocation is proportional to the overlap between the candle range and each row.
The highest-volume row supplies the volume-control reference, or POC. The value area expands from this row using neighbouring row volumes, with coverage set to 70% by default. Optional outer structure uses a 94% target. The calculation stops before adding a row that would exceed the target, so actual included coverage can be below the selected percentage.
Outer structure is visible by default, with a red upper line and a green lower line. Other structure lines, the developing POC trail and the histogram are off by default.
Profile resolution defaults to 24 rows and supports settings up to 500. Actual row count depends on tick-size rounding and the available price range. Histogram width represents relative row volume and supports a maximum-width setting of 500 chart bars, constrained to the elapsed profile period.
Directional clouds and interpretation
Directional clouds combine participation-weighted candle closing location, movement of a longer volume-weighted price centre, price displacement and shorter moving-average alignment. Their boundaries also incorporate volatility and directional progression.
Users can compare cloud direction and nearby volume structure with a qualifying signal when reviewing continuation or conflicting conditions. Neither cloud agreement nor a profile breakout is compulsory for Buy or Sale labels.
Behaviour and limitations
Labels appear only on confirmed candles on standard charts, with zero offset. VWAP lines can develop during an open candle. Profile calculations update on confirmed chart bars.
The volume profile is an estimate from candle data, not exchange volume-at-price, bid/ask delta or order-book activity. Sampling availability, chart timeframe, reported volume and loaded history can affect its appearance. Higher row counts and finer sampling can increase processing time.
The indicator identifies defined conditions; it does not predict reversals, manage positions, specify protective stops or provide strategy performance results.
Versionshinweise
SBP Value Momentum Navigator is a chart-overlay indicator that identifies confirmed momentum events relative to daily volume-weighted value and developing volume structure. It combines daily VWAP, one-standard-deviation bands, RSI and estimated outer profile boundaries within a single alternating Buy/Sale framework.The indicator uses one signal engine. Its opening qualification establishes an initial directional event for the daily period. Subsequent signals come from newly qualifying recovery or breakout conditions. Strict alternation prevents repeated Buy labels before an accepted Sale, and repeated Sale labels before an accepted Buy.
Calculation framework
Daily VWAP is calculated from typical price, with bands positioned one standard deviation above and below it. These references reset at the symbol’s daily timeframe boundary.
A developing volume profile provides additional price structure. The script samples available lower-timeframe candles and distributes each candle’s reported volume across the price rows intersecting its high–low range. Allocation is proportional to the amount of overlap with each row. If suitable samples are unavailable, chart-candle data is used.
This produces an estimated volume distribution. It does not reconstruct individual transactions, exchange volume at each price, bid/ask delta or order-book activity.
The profile defaults to 24 rows and a 70% value-area target. Row heights respect the instrument’s minimum tick size, so the resulting row count may differ from the requested setting.
The highest-volume row determines the Point of Control, represented by that row’s midpoint. Value-area boundaries expand outward from the POC toward the adjacent side with greater volume. Expansion stops before adding a row that would exceed the target. Outer structure uses the same procedure with a 94% target. These percentages are calculation targets rather than guaranteed exact coverage.
First daily signal
Before the first accepted signal of a new daily period, a Buy requires a confirmed close above daily VWAP and both deviation bands, together with RSI at or above the selected Buy threshold.
A Sale requires a confirmed close below daily VWAP and both deviation bands, with RSI at or below the selected Sale threshold.
The default RSI length is 14. The default Buy threshold is 60, and the default Sale threshold is 45. These inputs allow users to adjust momentum qualification for their instrument and timeframe.
Recovery and breakout signals
After the first accepted daily signal, the engine monitors two independent event paths.
A bullish recovery requires price to close above the developing outer lower boundary and the lower VWAP deviation band, while meeting the Buy RSI requirement. A bearish recovery requires a close below the outer upper boundary and upper deviation band, while meeting the Sale RSI requirement.
A bullish breakout requires acceptance above both the outer upper boundary and upper deviation band. A bearish breakout requires acceptance below both the outer lower boundary and lower deviation band. Each also requires its corresponding RSI qualification.
Recovery and breakout candidates occur when their conditions newly become true. Remaining within the same qualifying condition does not produce another event on every candle.
Alternation and daily resets
Every candidate passes through persistent direction memory. After an accepted Buy, another Buy is blocked until a Sale is accepted. After a Sale, another Sale is blocked until a Buy is accepted.
Daily setup tracking resets with the VWAP anchor, but direction memory continues across days. A new day therefore does not automatically permit a repeat of the previous accepted direction. Either direction can be the first signal in the available calculation history.
There is no fixed candle-gap requirement.
Displays and practical use
Optional displays include VWAP bands, value-area boundaries, outer structure, POC, a developing POC trail and a current-session histogram. Histogram width represents relative estimated volume within each price row. Its colours identify structural regions rather than measured buying and selling activity.
Directional clouds combine volume-weighted candle pressure, longer-reference movement, price displacement and short-term moving-average alignment. They provide visual context and do not directly qualify Buy/Sale signals.
Use standard intraday candlestick charts with reliable volume data. Signals appear on confirmed candles with zero plotting offset. Developing profile levels can change as later candles close, while live VWAP lines can move during an unfinished candle.
Sampling, available history and profile settings can affect structure-based signals. The histogram may differ from TradingView’s profile tools. The indicator does not place orders, define stops or targets, or guarantee profitable outcomes.

S B Prasad Trading Ecosystem Email : sbptradingecosystem@gmail.com, Mobile and Whatsup No +919903367725 .
Haftungsausschluss
Die Informationen und Veröffentlichungen sind nicht als Finanz-, Anlage-, Handels- oder andere Arten von Ratschlägen oder Empfehlungen gedacht, die von TradingView bereitgestellt oder gebilligt werden, und stellen diese nicht dar. Lesen Sie mehr in den Nutzungsbedingungen.
S B Prasad Trading Ecosystem Email : sbptradingecosystem@gmail.com, Mobile and Whatsup No +919903367725 .
Haftungsausschluss
Die Informationen und Veröffentlichungen sind nicht als Finanz-, Anlage-, Handels- oder andere Arten von Ratschlägen oder Empfehlungen gedacht, die von TradingView bereitgestellt oder gebilligt werden, und stellen diese nicht dar. Lesen Sie mehr in den Nutzungsbedingungen.