Simple Volatility Cone
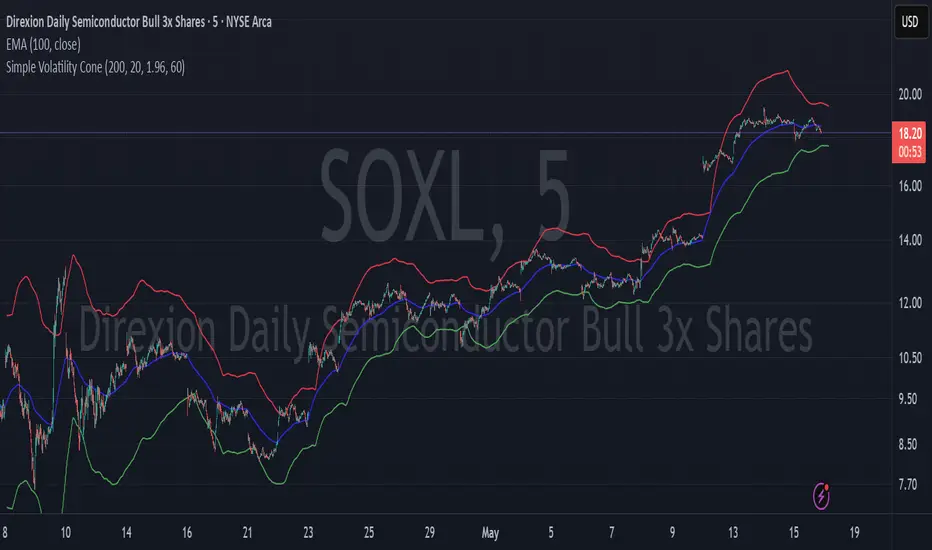
The Simple Volatility Cone indicator projects the potential future price range of a stock based on recent volatility. It calculates rolling standard deviation from log returns over a defined window, then uses a confidence interval to estimate the upper and lower bounds the price could reach over a future time horizon. These bounds are plotted directly on the chart, offset into the future, allowing traders to visualize expected price dispersion under a geometric Brownian motion assumption. This tool is useful for risk management, trade planning, and visualizing the potential impact of volatility.

Haftungsausschluss
Die Informationen und Veröffentlichungen sind nicht als Finanz-, Anlage-, Handels- oder andere Arten von Ratschlägen oder Empfehlungen gedacht, die von TradingView bereitgestellt oder gebilligt werden, und stellen diese nicht dar. Lesen Sie mehr in den Nutzungsbedingungen.
Haftungsausschluss
Die Informationen und Veröffentlichungen sind nicht als Finanz-, Anlage-, Handels- oder andere Arten von Ratschlägen oder Empfehlungen gedacht, die von TradingView bereitgestellt oder gebilligt werden, und stellen diese nicht dar. Lesen Sie mehr in den Nutzungsbedingungen.