JZ Breakout Volume
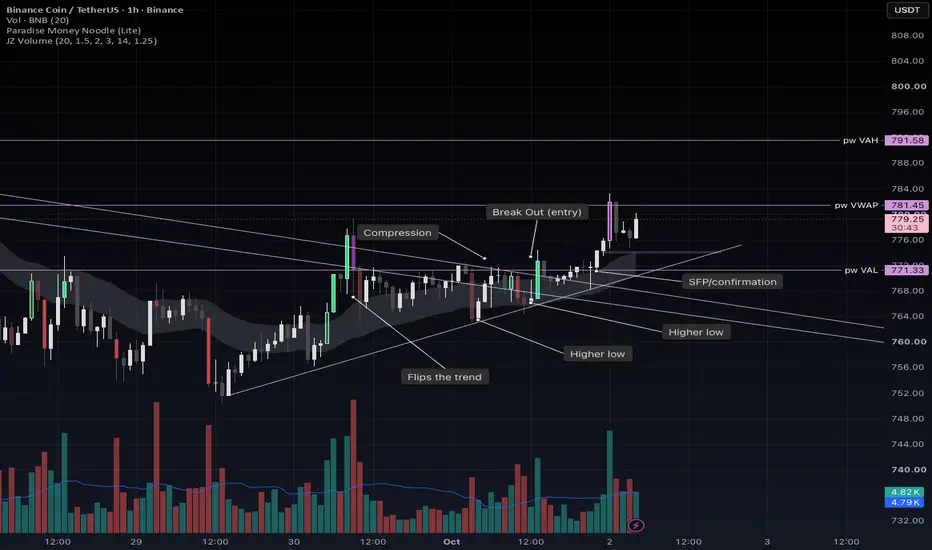
# JZ Breakout Volume
**JZ Breakout Volume** is a price-overlay indicator designed to make abnormal volume immediately visible on the chart.
The indicator was built primarily as a **confirmation tool for breakouts and breakdowns**. Rather than relying on visually comparing standard volume bars, it colours price candles when volume is significantly elevated relative to recent trading activity.
## How It Works
The indicator calculates **Relative Volume (RVOL)** by comparing the current candle's volume with the average volume of the previous 20 completed candles:
**RVOL = Current Volume ÷ Average Volume of Previous 20 Candles**
Using relative rather than absolute volume allows the indicator to adapt across different assets and timeframes.
By default:
- **1.5× RVOL** — Elevated participation
- **2.0× RVOL** — Strong participation
- **3.0× RVOL** — Extreme / potentially climactic participation
The indicator also measures **price expansion relative to ATR**.
A candle that produces both **2×+ relative volume and a range of at least 1.25× ATR** receives the strongest bullish or bearish highlighting. This helps distinguish high-volume candles that actually produce meaningful price expansion from candles where substantial volume generates little price movement.
## Candle Colours
Faded green/red indicates elevated volume.
Strong green/red indicates high relative volume.
Bright green/red identifies the primary signal: **strong relative volume combined with meaningful price expansion**.
Purple identifies **extreme relative volume (3×+)**. Extreme volume is intentionally treated separately because exceptionally high volume can represent continuation, climax, absorption, or exhaustion depending on market structure.
## Intended Use
This is **not a standalone entry signal**.
It is designed to provide additional confirmation when price is already presenting a technically valid setup, particularly:
**Consolidation → Higher Low / Lower High → Level or Trendline Break → Volume Expansion**
The objective is simple: make it immediately obvious when genuine market participation arrives during a breakout.
All major thresholds, including volume lookback, RVOL levels, ATR length, and price-expansion requirements, can be customized in the indicator settings.
**JZ Breakout Volume** is a price-overlay indicator designed to make abnormal volume immediately visible on the chart.
The indicator was built primarily as a **confirmation tool for breakouts and breakdowns**. Rather than relying on visually comparing standard volume bars, it colours price candles when volume is significantly elevated relative to recent trading activity.
## How It Works
The indicator calculates **Relative Volume (RVOL)** by comparing the current candle's volume with the average volume of the previous 20 completed candles:
**RVOL = Current Volume ÷ Average Volume of Previous 20 Candles**
Using relative rather than absolute volume allows the indicator to adapt across different assets and timeframes.
By default:
- **1.5× RVOL** — Elevated participation
- **2.0× RVOL** — Strong participation
- **3.0× RVOL** — Extreme / potentially climactic participation
The indicator also measures **price expansion relative to ATR**.
A candle that produces both **2×+ relative volume and a range of at least 1.25× ATR** receives the strongest bullish or bearish highlighting. This helps distinguish high-volume candles that actually produce meaningful price expansion from candles where substantial volume generates little price movement.
## Candle Colours
Faded green/red indicates elevated volume.
Strong green/red indicates high relative volume.
Bright green/red identifies the primary signal: **strong relative volume combined with meaningful price expansion**.
Purple identifies **extreme relative volume (3×+)**. Extreme volume is intentionally treated separately because exceptionally high volume can represent continuation, climax, absorption, or exhaustion depending on market structure.
## Intended Use
This is **not a standalone entry signal**.
It is designed to provide additional confirmation when price is already presenting a technically valid setup, particularly:
**Consolidation → Higher Low / Lower High → Level or Trendline Break → Volume Expansion**
The objective is simple: make it immediately obvious when genuine market participation arrives during a breakout.
All major thresholds, including volume lookback, RVOL levels, ATR length, and price-expansion requirements, can be customized in the indicator settings.

Haftungsausschluss
Die Informationen und Veröffentlichungen sind nicht als Finanz-, Anlage-, Handels- oder andere Arten von Ratschlägen oder Empfehlungen gedacht, die von TradingView bereitgestellt oder gebilligt werden, und stellen diese nicht dar. Lesen Sie mehr in den Nutzungsbedingungen.
Haftungsausschluss
Die Informationen und Veröffentlichungen sind nicht als Finanz-, Anlage-, Handels- oder andere Arten von Ratschlägen oder Empfehlungen gedacht, die von TradingView bereitgestellt oder gebilligt werden, und stellen diese nicht dar. Lesen Sie mehr in den Nutzungsbedingungen.