Session Candles [josseliani]
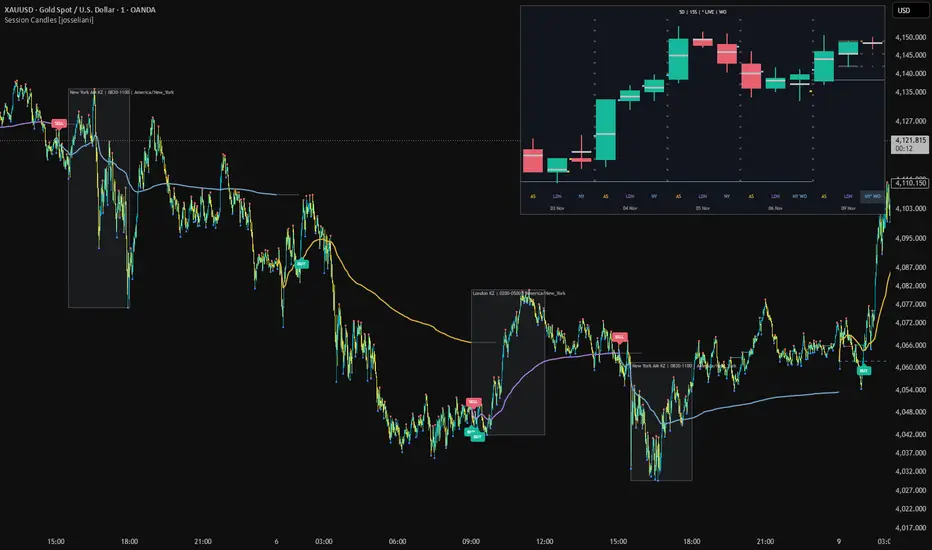
Each trading session — one candle. A familiar way to read the structure of the day: where the range expanded, where a previous High or Low was taken, and where price remained beyond it.
Session Candles displays these periods as a compact mini-chart directly on your main chart, bringing several sessions together in a familiar candlestick view.
💡 HOW TO USE
Read session candles the way you read regular candlestick patterns. Choose the trading periods you want to follow and apply your own approach to reading price and candle combinations.
For example, explore Power of Three scenarios relative to Weekly Open, Fair Value Gap configurations between session candles, engulfing patterns, reversal combinations, higher highs and lower lows.
Watch how one session interacts with another, just as you would analyse individual candles: does it sweep the previous High or Low and return inside, close beyond the range, or continue the preceding move?
These are ways to interpret the candles visually. The indicator does not automatically identify these patterns.
The main chart also provides session VWAP, structure-based BUY/SELL signals and Kill Zone boxes. The boxes highlight selected trading hours and help you view signals in their time context. They are visual references and do not filter signals.
You can adjust the candle periods and box hours to focus on the trading windows that matter to you.
📱 Using the indicator on your phone? Enable “Mobile view” in the settings to display the mini-chart in a more compact size with shorter labels. This reduces its width and height by 25%. Mobile view is off by default.
🧩 KEY FEATURE
The candles are built from your chosen time windows, rather than a standard chart timeframe.
The default schedule divides the day into three periods in New York time:
Use sequential trading sessions, equal eight-hour periods or custom intervals. Windows can overlap or have gaps between them — the choice is yours.
This lets you compare the Open, High, Low and Close of the periods that matter to your trading, while keeping the main chart available for intraday detail.
📖 READING THE MINI-CHART
Session candles display Open, High, Low and Close on a shared price scale, with day separators and session labels. The live candle updates as new data arrives, showing how its body and wicks develop.
🔵 Blue marker — BREAK. Price traded beyond the previous session’s High or Low, and the session close is beyond that level.
🟡 Yellow marker — SWEEP. Price traded beyond the previous session’s High or Low, and the session close returned to that level or inside the range.
High and Low are evaluated separately. Markers on the live candle are provisional and may change until the session closes.
The short light line on each candle marks 50% of its full High–Low range. Gray guides beside the latest candle show the previous session’s High, Low and midpoint. Weekly Open provides a reference across the candles belonging to that trading week.
When windows overlap, the previous session’s reference levels are frozen at the start of the new session. Overlapping candles share price data, which should be considered when reading their combinations.
📊 ON THE MAIN CHART
🔔 SIGNALS
Signals combine a confirmed structure break with the active session VWAP. BUY requires the broken pivot level and closing price to be above VWAP; SELL requires both to be below it. An optional EMA filter provides an additional condition.
Signals aim to identify the session’s developing direction. If the first attempt does not follow through, the indicator allows another qualifying signal in the opposite direction. Once price moves 1 ATR in favour of a signal, the search stops until the next session.
Up to three attempts are allowed per session. The distance uses ATR(14) from the chart timeframe, fixed when the signal appears. Subsequent highs and lows, including wicks, count towards that distance; the signal bar itself is excluded.
This is an ATR distance, not a 1R profit target. The indicator does not calculate a trade’s stop-loss risk.
The selected chart timeframe therefore affects the signals. For example, a move may already reach the required ATR distance on a one-minute chart, blocking further opposite-direction signals for that session. On a five-minute chart, its own ATR threshold may not yet have been reached, so another qualifying signal can still appear. Structure confirmation also differs between timeframes.
This rule stops the search for new signals; it does not remove or rewrite an earlier confirmed signal.
Signals are confirmed on the main-chart bar’s close. Alerts are available for BUY, SELL and either direction.
⚙️ SETTINGS
By default, the signal delay is zero, and both the EMA filter and EMA line are off. Pivot dots and BOS levels can be hidden without disabling their use in signal calculations.
⚠️ IMPORTANT NOTES
Session Candles displays these periods as a compact mini-chart directly on your main chart, bringing several sessions together in a familiar candlestick view.
💡 HOW TO USE
Read session candles the way you read regular candlestick patterns. Choose the trading periods you want to follow and apply your own approach to reading price and candle combinations.
For example, explore Power of Three scenarios relative to Weekly Open, Fair Value Gap configurations between session candles, engulfing patterns, reversal combinations, higher highs and lower lows.
Watch how one session interacts with another, just as you would analyse individual candles: does it sweep the previous High or Low and return inside, close beyond the range, or continue the preceding move?
These are ways to interpret the candles visually. The indicator does not automatically identify these patterns.
The main chart also provides session VWAP, structure-based BUY/SELL signals and Kill Zone boxes. The boxes highlight selected trading hours and help you view signals in their time context. They are visual references and do not filter signals.
You can adjust the candle periods and box hours to focus on the trading windows that matter to you.
📱 Using the indicator on your phone? Enable “Mobile view” in the settings to display the mini-chart in a more compact size with shorter labels. This reduces its width and height by 25%. Mobile view is off by default.
🧩 KEY FEATURE
The candles are built from your chosen time windows, rather than a standard chart timeframe.
The default schedule divides the day into three periods in New York time:
[]Asia — 18:00–02:00.
[]London — 02:00–08:00.- New York — 08:00–18:00.
Use sequential trading sessions, equal eight-hour periods or custom intervals. Windows can overlap or have gaps between them — the choice is yours.
This lets you compare the Open, High, Low and Close of the periods that matter to your trading, while keeping the main chart available for intraday detail.
📖 READING THE MINI-CHART
Session candles display Open, High, Low and Close on a shared price scale, with day separators and session labels. The live candle updates as new data arrives, showing how its body and wicks develop.
🔵 Blue marker — BREAK. Price traded beyond the previous session’s High or Low, and the session close is beyond that level.
🟡 Yellow marker — SWEEP. Price traded beyond the previous session’s High or Low, and the session close returned to that level or inside the range.
High and Low are evaluated separately. Markers on the live candle are provisional and may change until the session closes.
The short light line on each candle marks 50% of its full High–Low range. Gray guides beside the latest candle show the previous session’s High, Low and midpoint. Weekly Open provides a reference across the candles belonging to that trading week.
When windows overlap, the previous session’s reference levels are frozen at the start of the new session. Overlapping candles share price data, which should be considered when reading their combinations.
📊 ON THE MAIN CHART
[]Session VWAP.
[]The completed session’s final VWAP, optionally extended as a frozen gray reference for 60 minutes.
[]Previous-session High and Low with labels.
[]Weekly Open and optional Daily Open, H1 Open and H4 Open.
[]Confirmed pivot dots and Break of Structure levels.
[]Session BUY/SELL signals.- Configurable Kill Zone boxes, including an optional third window.
🔔 SIGNALS
Signals combine a confirmed structure break with the active session VWAP. BUY requires the broken pivot level and closing price to be above VWAP; SELL requires both to be below it. An optional EMA filter provides an additional condition.
Signals aim to identify the session’s developing direction. If the first attempt does not follow through, the indicator allows another qualifying signal in the opposite direction. Once price moves 1 ATR in favour of a signal, the search stops until the next session.
Up to three attempts are allowed per session. The distance uses ATR(14) from the chart timeframe, fixed when the signal appears. Subsequent highs and lows, including wicks, count towards that distance; the signal bar itself is excluded.
This is an ATR distance, not a 1R profit target. The indicator does not calculate a trade’s stop-loss risk.
The selected chart timeframe therefore affects the signals. For example, a move may already reach the required ATR distance on a one-minute chart, blocking further opposite-direction signals for that session. On a five-minute chart, its own ATR threshold may not yet have been reached, so another qualifying signal can still appear. Structure confirmation also differs between timeframes.
This rule stops the search for new signals; it does not remove or rewrite an earlier confirmed signal.
Signals are confirmed on the main-chart bar’s close. Alerts are available for BUY, SELL and either direction.
⚙️ SETTINGS
[]Session presets, custom time windows and schedule timezone.
[]One to eight trading days, with mini-chart width adapting to the selected number of days.
[]Four corner positions.
[]Midpoint marks, previous-session guides and sweep/break markers.
[]Optional reference levels, pivot dots and BOS drawings.
[]Configurable Kill Zone windows.
[]Optional delay after the session starts.
[]Optional EMA filter with a default length of 21.
By default, the signal delay is zero, and both the EMA filter and EMA line are off. Pivot dots and BOS levels can be hidden without disabling their use in signal calculations.
⚠️ IMPORTANT NOTES
[]Use standard intraday charts of 60 minutes or less. Session boundaries must align with chart bars.
[]Confirmed pivots require four bars to the right and are then displayed on their original bars. They become available to the signal logic only after confirmation.
[]VWAP requires usable volume data. Changing the chart timeframe can change VWAP, structure and signals.
[]Daily and Weekly Open follow the session-based trading calendar. H1 and H4 Open are anchored to the session-day start and may differ from standard chart candle opens.- For recognised gold symbols, signals are blocked from 18:00 to 19:00 New York time.

Indicators, updates & setups:
magicdiagonals.com/
Free Telegram: t.me/magicdiagonals
magicdiagonals.com/
Free Telegram: t.me/magicdiagonals
Haftungsausschluss
Die Informationen und Veröffentlichungen sind nicht als Finanz-, Anlage-, Handels- oder andere Arten von Ratschlägen oder Empfehlungen gedacht, die von TradingView bereitgestellt oder gebilligt werden, und stellen diese nicht dar. Lesen Sie mehr in den Nutzungsbedingungen.
Indicators, updates & setups:
magicdiagonals.com/
Free Telegram: t.me/magicdiagonals
magicdiagonals.com/
Free Telegram: t.me/magicdiagonals
Haftungsausschluss
Die Informationen und Veröffentlichungen sind nicht als Finanz-, Anlage-, Handels- oder andere Arten von Ratschlägen oder Empfehlungen gedacht, die von TradingView bereitgestellt oder gebilligt werden, und stellen diese nicht dar. Lesen Sie mehr in den Nutzungsbedingungen.