OPEN-SOURCE SCRIPT
Aktualisiert Scalper Trend Day Filter v4
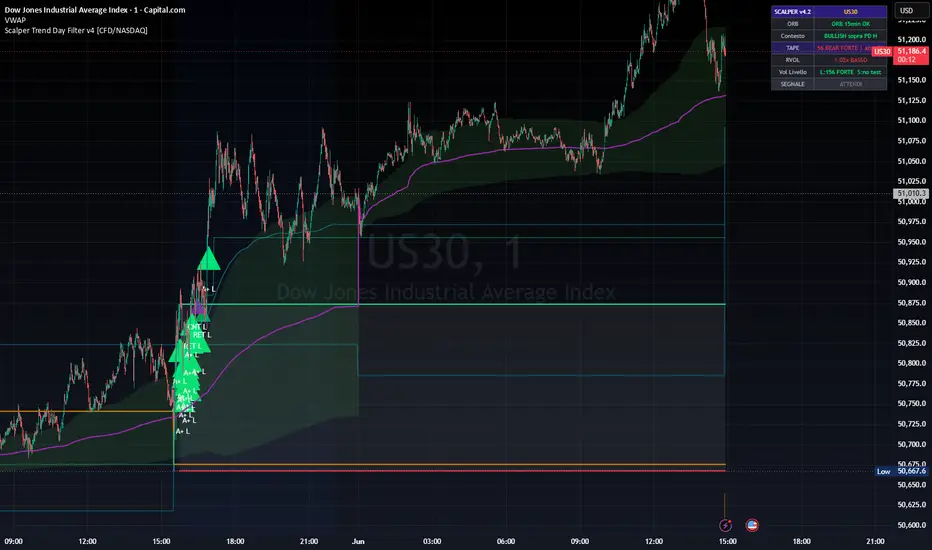
What it does:
This indicator identifies high-probability intraday trade signals on NAS100 (and other CFD/futures instruments) using a dual-layer institutional scoring system built around the Opening Range Breakout (ORB).
How it works:
Every signal requires two independent scores to align:
ORB Score (0–5 pts): measures the quality of the ORB breakout — acceptance candles beyond the range, volume at the first level test, RVOL, daily ATR headroom, and directional context.
Breakout Quality Score (0–5 pts): measures real-time confirmation at the moment of the signal — candle direction, MACD 1m zero-line, RSI momentum (near 70/30 = strength, not obstacle), volume vs 2-sigma threshold, and price position relative to previous session VWAP and POC.
Three signal types:
A+ (large arrow): full alignment — ORB score 5/5 + BQ score ≥ 3 + confirmed directional context
RET (medium arrow): retest of the ORB level with confirmed volume + dynamic context
INV / CNT (small arrow): balance zone breakout after consolidation post-ORB
Context logic — static + dynamic:
Static context uses previous day High/Low. Dynamic context reads live session levels: if price breaks below VWAP, current POC, and previous session POC simultaneously, the indicator recognizes a real-time bearish bias even in a technically "neutral" day — and enables RET SHORT signals accordingly.
Levels plotted:
ORB High / Low (building + confirmed)
Previous Day High / Low
Previous session POC (orange) — yesterday's institutional volume node
Current session VWAP (blue) — live fair value
Current session POC (green) — where today's volume is concentrating
Recommended settings:
Timeframe: 1m or 5m
Instrument: NAS100, US100, equity futures, liquid CFDs
Session: set NY open/close to your chart timezone
This indicator identifies high-probability intraday trade signals on NAS100 (and other CFD/futures instruments) using a dual-layer institutional scoring system built around the Opening Range Breakout (ORB).
How it works:
Every signal requires two independent scores to align:
ORB Score (0–5 pts): measures the quality of the ORB breakout — acceptance candles beyond the range, volume at the first level test, RVOL, daily ATR headroom, and directional context.
Breakout Quality Score (0–5 pts): measures real-time confirmation at the moment of the signal — candle direction, MACD 1m zero-line, RSI momentum (near 70/30 = strength, not obstacle), volume vs 2-sigma threshold, and price position relative to previous session VWAP and POC.
Three signal types:
A+ (large arrow): full alignment — ORB score 5/5 + BQ score ≥ 3 + confirmed directional context
RET (medium arrow): retest of the ORB level with confirmed volume + dynamic context
INV / CNT (small arrow): balance zone breakout after consolidation post-ORB
Context logic — static + dynamic:
Static context uses previous day High/Low. Dynamic context reads live session levels: if price breaks below VWAP, current POC, and previous session POC simultaneously, the indicator recognizes a real-time bearish bias even in a technically "neutral" day — and enables RET SHORT signals accordingly.
Levels plotted:
ORB High / Low (building + confirmed)
Previous Day High / Low
Previous session POC (orange) — yesterday's institutional volume node
Current session VWAP (blue) — live fair value
Current session POC (green) — where today's volume is concentrating
Recommended settings:
Timeframe: 1m or 5m
Instrument: NAS100, US100, equity futures, liquid CFDs
Session: set NY open/close to your chart timezone
Versionshinweise
POC Calculation Fix — Institutional Accuracy UpgradePrevious version (inaccurate):
The bucket size was recalculated on every bar as the session's high-low range expanded. This meant volume assigned in early bars was placed in the wrong price buckets when new highs or lows were made later in the session. The resulting POC was mathematically distorted — biased toward the center of the range rather than reflecting where volume actually concentrated.
New version (accurate):
The price grid is now fixed once at session open, based on the previous day's high-low range multiplied by 1.5 for margin. Bucket boundaries never change during the session — every bar accumulates volume in the correct and consistent price level from open to close.
Additional improvements:
Buckets increased from 30 to 50 — on NAS100 this gives approximately 4-8 points per bucket, sufficient precision for an institutional level
ATR-based fallback if previous day data is unavailable
prevPOC is saved precisely at session close before reset, ensuring the previous session POC plotted the next day is always accurate
Result:
The orange POC line now reflects the true price level of maximum volume concentration from the previous NY session — a reliable institutional reference for support, resistance, and context confirmation.
Versionshinweise
Tape Analysis Integration & Table Simplification — v4.2 UpgradeTape Analysis — Fully Integrated as Primary Signal Gate
The indicator now incorporates real-time directional volume analysis directly into the signal logic, replacing the simple candle direction check (close > open) with a weighted bull/bear ratio derived from intra-bar sub-timeframe data.
On 5-minute charts, request.security_lower_tf pulls the individual 1-minute bars contained within each 5-minute bar and calculates true directional volume split — bull volume (price moving up), bear volume (price moving down), and absorbed volume (price unchanged despite activity). On 1-minute charts, the same function returns the current bar as the base unit.
Tape weight in the Breakout Quality Score (BQ):
Ratio ≥ 3.0 — strong institutional aggression — 2 points
Ratio ≥ 1.5 — good participation — 1 point
Ratio < 1.5 — no aggression — 0 points + A+ signal blocked
This means an A+ signal cannot fire without confirmed tape aggression, regardless of all other conditions aligning. A breakout on NAS100 where price moves but the bull/bear ratio is flat will be suppressed.
Absorbed volume used in retest logic:
When absorbed volume exceeds 30% of total bar volume at the ORB level, the indicator recognizes the level as institutionally defended. This unlocks the RET signal even without a volume spike, because high absorption at a key level is itself the confirmation — sellers are being absorbed, not breaking through.
Table Simplified to Operational Essentials
The table now shows exactly 7 rows — everything needed for a decision, nothing that creates noise:
ORB — range formation status
Context — static (prev day H/L) or dynamic (live session VWAP + POC levels)
TAPE — ratio value, direction (BULL / BULL FORTE / BEAR / BEAR FORTE / neutro), absorbed volume percentage
RVOL — current relative volume vs session average
Vol Livello — volume recorded at the last ORB High and ORB Low test
Signal — final output (A+ LONG / A+ SHORT / RET / INV / CNT / ATTENDI)
All other calculations (RSI, MACD, ATR, BQ scores, balance zone, POC magnet) remain active in the signal logic but are removed from the display.
Open-source Skript
Ganz im Sinne von TradingView hat dieser Autor sein/ihr Script als Open-Source veröffentlicht. Auf diese Weise können nun auch andere Trader das Script rezensieren und die Funktionalität überprüfen. Vielen Dank an den Autor! Sie können das Script kostenlos verwenden, aber eine Wiederveröffentlichung des Codes unterliegt unseren Hausregeln.

Haftungsausschluss
Die Informationen und Veröffentlichungen sind nicht als Finanz-, Anlage-, Handels- oder andere Arten von Ratschlägen oder Empfehlungen gedacht, die von TradingView bereitgestellt oder gebilligt werden, und stellen diese nicht dar. Lesen Sie mehr in den Nutzungsbedingungen.
Open-source Skript
Ganz im Sinne von TradingView hat dieser Autor sein/ihr Script als Open-Source veröffentlicht. Auf diese Weise können nun auch andere Trader das Script rezensieren und die Funktionalität überprüfen. Vielen Dank an den Autor! Sie können das Script kostenlos verwenden, aber eine Wiederveröffentlichung des Codes unterliegt unseren Hausregeln.
Haftungsausschluss
Die Informationen und Veröffentlichungen sind nicht als Finanz-, Anlage-, Handels- oder andere Arten von Ratschlägen oder Empfehlungen gedacht, die von TradingView bereitgestellt oder gebilligt werden, und stellen diese nicht dar. Lesen Sie mehr in den Nutzungsbedingungen.