OPEN-SOURCE SCRIPT
Cadence Veil [JOAT]
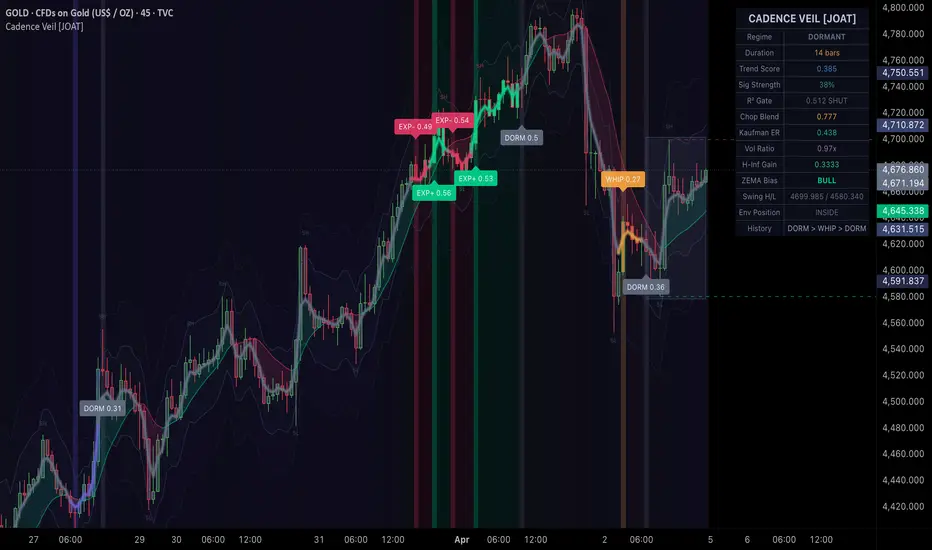
Cadence Veil [JOAT]/b]
Introduction
Cadence Veil is an advanced open-source regime classification indicator that fuses an H-Infinity adaptive filter, R-squared efficiency gating, dual-window chop scoring, and Kaufman adaptive efficiency into a unified five-state regime engine. The indicator classifies every bar into one of five market states — Expansion Bull, Expansion Bear, Compression, Whipsaw, or Dormant — using a hysteresis state machine that prevents rapid flip-flopping between regimes. It then overlays volatility envelope bands, a ZEMA bias ribbon, structural pivot tracking, regime shift boxes, and gradient visualization to create a complete market phase recognition system.
The core problem this indicator solves is regime misidentification. Most traders apply the same strategy regardless of market conditions — trend-following in chop, mean-reversion in trends, or trading during dormant periods when nothing meaningful is happening. Each of these mismatches leads to losses. Cadence Veil explicitly classifies the current regime so traders can select the appropriate strategy for the conditions. A compression regime calls for breakout preparation. An expansion regime calls for trend-following. A whipsaw regime calls for caution or sitting out entirely. A dormant regime means the market lacks the energy for any strategy to work reliably.

Core Concepts
1. H-Infinity Adaptive Filter
The centerline of the indicator uses an H-Infinity filter rather than a conventional moving average. H-Infinity filtering is a control theory technique designed to produce optimal estimates under worst-case noise conditions. Unlike a Kalman filter (which assumes Gaussian noise), the H-Infinity filter makes no assumptions about noise distribution, making it more robust in financial markets where price noise is decidedly non-Gaussian:
Pine Script®
The filter maintains internal state and error estimates that adapt each bar. The gain parameter (error divided by error plus disturbance) determines how much the filter trusts new data versus its existing estimate. Higher disturbance values make the filter more conservative (smoother); lower values make it more responsive. The filter order parameter controls how many state dimensions are tracked, with higher orders providing more sophisticated noise modeling.
2. R-Squared Efficiency Gate
R-squared measures how well price movement fits a linear regression line. A high R-squared (close to 1.0) means price is moving in a straight, efficient line — a strong trend. A low R-squared (close to 0) means price is moving randomly with no directional efficiency:
Pine Script®
The indicator uses an auto-calibrating threshold: the rolling mean of R-squared plus k standard deviations. This means the threshold adapts to the instrument's typical trending behavior. A hysteresis band prevents the gate from flickering — once open, R-squared must drop further to close the gate than it needed to rise to open it.
3. Dual-Window Chop Scoring
Chop is measured using the efficiency ratio concept: the net price movement divided by the total path length over a window. A perfectly straight move scores 0 (no chop); a move that goes nowhere despite lots of bar-to-bar movement scores 1 (maximum chop). The indicator uses two windows — a fast window (default 14 bars) for recent chop and a slow window (default 50 bars) for structural chop — and blends them:
Pine Script®
The dual-window approach catches both short-term whipsaws and longer-term structural chop that a single window might miss.
4. Kaufman Efficiency Ratio
The Kaufman ER provides a third independent measure of trend quality. It compares the absolute net price change over N bars to the sum of all bar-to-bar changes over the same period. Values near 1.0 indicate efficient, directional movement; values near 0 indicate noisy, non-directional movement. This complements R-squared (which measures linearity) and chop score (which measures path efficiency) by measuring absolute directional efficiency.
5. Composite Trend Score and State Machine
The three measures are blended into a single composite trend score:
Pine Script®
This score, combined with the H-Infinity filter slope and volatility ratio, feeds into a five-state machine with persistence requirements. A candidate state must hold for a configurable number of consecutive bars (default 3) before the regime officially transitions. This prevents single-bar noise from triggering false regime changes.
The five states are:
6. Volatility Envelope Bands
Adaptive bands are constructed around the H-Infinity line using ZEMA-smoothed ATR. The bands scale their width based on the current regime: narrower during compression (0.7x), wider during expansion (1.2x), and standard during normal conditions. This regime-adaptive scaling means the bands contract when the market is coiling (tightening the range for breakout detection) and expand when the market is trending (giving the trend room to breathe).
Features
Input Parameters
H-Infinity Filter:
Efficiency Gate:
Chop Detector:
State Engine:
Volatility Envelope:
Visuals:

How to Use This Indicator
Step 1: Identify the Current Regime
The dashboard's regime field and the background coloring immediately tell you the market phase. This is the most important piece of information — it determines which strategy to apply.
Step 2: Match Strategy to Regime
Step 3: Use Signal Strength for Conviction
The composite signal strength (0-100) tells you how aligned all subsystems are. A 75+ score during an expansion regime is high-conviction. A 25 score during expansion suggests the regime may be weakening.
Step 4: Monitor Regime Transitions
Regime shift boxes and labels mark exactly where transitions occurred. The most profitable trades often come at the transition from compression to expansion — the breakout from a coiled market.
Step 5: Read the Regime History
The history chain (e.g., "COMP > EXP+ > DORM") reveals the market's recent phase pattern. A sequence like "COMP > EXP+ > COMP > EXP+" suggests a market that trends in bursts between consolidation periods.
Cadence Veil showing a regime transition sequence: compression (purple box) resolving into expansion bull (green box), with the H-Infinity line glow intensifying, envelope bands widening, and the trend score rising in the dashboard
Indicator Limitations
Originality Statement
This indicator is original in its application of control theory (H-Infinity filtering) to market regime classification and its synthesis of multiple independent efficiency measures into a unified state machine. While regime detection and adaptive filtering are established concepts, this indicator is justified because:
Disclaimer
This indicator is provided for educational and informational purposes only. It is not financial advice or a recommendation to buy or sell any financial instrument. Trading involves substantial risk of loss. Regime classifications are based on historical data analysis and do not predict future market phases. A market classified as "Expansion Bull" can reverse at any time. Compression does not guarantee a subsequent breakout, and the direction of any breakout is not predicted by the compression classification. Always use proper risk management and conduct your own analysis. The author is not responsible for any losses incurred from using this indicator.
-Made with passion by officialjackofalltrades
Introduction
Cadence Veil is an advanced open-source regime classification indicator that fuses an H-Infinity adaptive filter, R-squared efficiency gating, dual-window chop scoring, and Kaufman adaptive efficiency into a unified five-state regime engine. The indicator classifies every bar into one of five market states — Expansion Bull, Expansion Bear, Compression, Whipsaw, or Dormant — using a hysteresis state machine that prevents rapid flip-flopping between regimes. It then overlays volatility envelope bands, a ZEMA bias ribbon, structural pivot tracking, regime shift boxes, and gradient visualization to create a complete market phase recognition system.
The core problem this indicator solves is regime misidentification. Most traders apply the same strategy regardless of market conditions — trend-following in chop, mean-reversion in trends, or trading during dormant periods when nothing meaningful is happening. Each of these mismatches leads to losses. Cadence Veil explicitly classifies the current regime so traders can select the appropriate strategy for the conditions. A compression regime calls for breakout preparation. An expansion regime calls for trend-following. A whipsaw regime calls for caution or sitting out entirely. A dormant regime means the market lacks the energy for any strategy to work reliably.
Core Concepts
1. H-Infinity Adaptive Filter
The centerline of the indicator uses an H-Infinity filter rather than a conventional moving average. H-Infinity filtering is a control theory technique designed to produce optimal estimates under worst-case noise conditions. Unlike a Kalman filter (which assumes Gaussian noise), the H-Infinity filter makes no assumptions about noise distribution, making it more robust in financial markets where price noise is decidedly non-Gaussian:
The filter maintains internal state and error estimates that adapt each bar. The gain parameter (error divided by error plus disturbance) determines how much the filter trusts new data versus its existing estimate. Higher disturbance values make the filter more conservative (smoother); lower values make it more responsive. The filter order parameter controls how many state dimensions are tracked, with higher orders providing more sophisticated noise modeling.
2. R-Squared Efficiency Gate
R-squared measures how well price movement fits a linear regression line. A high R-squared (close to 1.0) means price is moving in a straight, efficient line — a strong trend. A low R-squared (close to 0) means price is moving randomly with no directional efficiency:
The indicator uses an auto-calibrating threshold: the rolling mean of R-squared plus k standard deviations. This means the threshold adapts to the instrument's typical trending behavior. A hysteresis band prevents the gate from flickering — once open, R-squared must drop further to close the gate than it needed to rise to open it.
3. Dual-Window Chop Scoring
Chop is measured using the efficiency ratio concept: the net price movement divided by the total path length over a window. A perfectly straight move scores 0 (no chop); a move that goes nowhere despite lots of bar-to-bar movement scores 1 (maximum chop). The indicator uses two windows — a fast window (default 14 bars) for recent chop and a slow window (default 50 bars) for structural chop — and blends them:
The dual-window approach catches both short-term whipsaws and longer-term structural chop that a single window might miss.
4. Kaufman Efficiency Ratio
The Kaufman ER provides a third independent measure of trend quality. It compares the absolute net price change over N bars to the sum of all bar-to-bar changes over the same period. Values near 1.0 indicate efficient, directional movement; values near 0 indicate noisy, non-directional movement. This complements R-squared (which measures linearity) and chop score (which measures path efficiency) by measuring absolute directional efficiency.
5. Composite Trend Score and State Machine
The three measures are blended into a single composite trend score:
This score, combined with the H-Infinity filter slope and volatility ratio, feeds into a five-state machine with persistence requirements. A candidate state must hold for a configurable number of consecutive bars (default 3) before the regime officially transitions. This prevents single-bar noise from triggering false regime changes.
The five states are:
- Expansion Bull: R-squared gate open, trend score above threshold, H-Infinity slope positive
- Expansion Bear: R-squared gate open, trend score above threshold, H-Infinity slope negative
- Compression: High chop score, low volatility ratio — market is coiling
- Whipsaw: High volatility but also high chop — dangerous conditions with large moves in both directions
- Dormant: None of the above conditions met — market lacks energy or direction
6. Volatility Envelope Bands
Adaptive bands are constructed around the H-Infinity line using ZEMA-smoothed ATR. The bands scale their width based on the current regime: narrower during compression (0.7x), wider during expansion (1.2x), and standard during normal conditions. This regime-adaptive scaling means the bands contract when the market is coiling (tightening the range for breakout detection) and expand when the market is trending (giving the trend room to breathe).
Features
- Five-State Regime Classification: Clear categorical identification of the current market phase with color-coded rendering throughout the indicator
- H-Infinity Core Line with Glow: The adaptive filter line renders with a gradient glow whose color and intensity reflect the current regime and trend score
- Regime Shift Boxes: When the regime changes, a colored box is drawn that expands to encompass the price range of the new regime, providing a visual record of regime transitions
- Regime Shift Labels: Labels at regime transitions show the new regime abbreviation and the trend score at the time of transition
- ZEMA Bias Ribbon: A filled ribbon between the H-Infinity line and its ZEMA shows directional bias with bull/bear coloring
- Structural Pivot Detection: Swing highs and lows are identified and labeled with regime context — pivots formed during expansion regimes are colored differently than those formed during compression
- Structure Lines: Dashed horizontal lines at the most recent swing high and low provide support/resistance reference
- Envelope Breach Detection: The dashboard reports whether price is inside the bands, above/below the inner band, or above/below the outer band
- Composite Signal Strength: A 0-100 score measuring how aligned all subsystems are (R-squared gate, Kaufman ER, chop score, and ZEMA bias)
- Regime History Tracking: The dashboard shows the last three regime states in sequence, revealing the pattern of market phase transitions
- Gradient Background Zones: Background coloring shifts on a gradient from compression tones to the current regime color based on the trend score
- Regime-Aware Bar Coloring: Candle colors reflect the current regime with momentum-based gradient intensity
- 14-Row Dashboard: Displays regime state, duration, trend score, signal strength, R-squared gate status, chop blend, Kaufman ER, volatility ratio, H-Infinity gain, ZEMA bias, swing levels, envelope position, and regime history
Input Parameters
H-Infinity Filter:
- Filter Order: Number of state-space dimensions (default: 3, range: 1-8)
- Process Noise: Expected noise level (default: 0.5)
- Disturbance: External disruption parameter (default: 1.0)
Efficiency Gate:
- R-Squared Length: Correlation calculation period (default: 30)
- Smoothing: R-squared smoothing period (default: 10)
- Threshold k: Standard deviations above mean for auto-threshold (default: 1.0)
Chop Detector:
- Fast Window: Short-term chop measurement (default: 14)
- Slow Window: Long-term chop measurement (default: 50)
State Engine:
- Entry Persistence: Consecutive bars required for regime transition (default: 3)
- Hysteresis Band: Width of the hysteresis zone to prevent flickering (default: 0.15)
Volatility Envelope:
- Inner/Outer ATR Multipliers: Band distance from the core line (default: 1.2/2.4)
- ATR Length: Period for ATR calculation (default: 14)
Visuals:
- Toggles for envelope bands, ZEMA bias ribbon, structural pivots, structure lines, regime shift boxes, regime shift signals, background zones, bar coloring, and dashboard
How to Use This Indicator
Step 1: Identify the Current Regime
The dashboard's regime field and the background coloring immediately tell you the market phase. This is the most important piece of information — it determines which strategy to apply.
Step 2: Match Strategy to Regime
- Expansion Bull/Bear: Use trend-following strategies. Enter pullbacks to the H-Infinity line or inner band in the direction of the expansion
- Compression: Prepare for a breakout. Tighten stops, reduce position sizes, and watch for the regime to shift to expansion. The ZEMA bias may hint at the breakout direction
- Whipsaw: Reduce exposure or sit out. This regime produces large moves in both directions that stop out trend-followers and mean-reversion traders alike
- Dormant: No edge exists. Wait for the market to wake up
Step 3: Use Signal Strength for Conviction
The composite signal strength (0-100) tells you how aligned all subsystems are. A 75+ score during an expansion regime is high-conviction. A 25 score during expansion suggests the regime may be weakening.
Step 4: Monitor Regime Transitions
Regime shift boxes and labels mark exactly where transitions occurred. The most profitable trades often come at the transition from compression to expansion — the breakout from a coiled market.
Step 5: Read the Regime History
The history chain (e.g., "COMP > EXP+ > DORM") reveals the market's recent phase pattern. A sequence like "COMP > EXP+ > COMP > EXP+" suggests a market that trends in bursts between consolidation periods.
Cadence Veil showing a regime transition sequence: compression (purple box) resolving into expansion bull (green box), with the H-Infinity line glow intensifying, envelope bands widening, and the trend score rising in the dashboard
Indicator Limitations
- The H-Infinity filter, while theoretically robust, has three parameters (order, noise, disturbance) that significantly affect behavior. Optimal settings vary across instruments and timeframes and may require experimentation
- The persistence requirement for regime transitions (default 3 bars) creates a delay. Fast regime changes may be identified several bars after they begin. This is a deliberate trade-off for stability
- The five-state classification is a simplification of continuous market behavior. Markets can exist in states that don't cleanly fit any category, and the boundaries between states are inherently fuzzy
- R-squared, chop score, and Kaufman ER all use lookback windows. They describe what the market has been doing, not what it will do. A regime can change immediately after being classified
- The whipsaw state is identified but no strategy is recommended for it because whipsaw conditions are inherently difficult to trade profitably. The indicator's value here is in warning you to reduce exposure
- Volatility envelope bands adapt to the regime but still use ATR, which is backward-looking. Sudden volatility shifts (news events, gaps) may not be reflected in the bands for several bars
Originality Statement
This indicator is original in its application of control theory (H-Infinity filtering) to market regime classification and its synthesis of multiple independent efficiency measures into a unified state machine. While regime detection and adaptive filtering are established concepts, this indicator is justified because:
- The H-Infinity filter is rarely used in technical analysis. Its worst-case noise optimization makes it theoretically more appropriate for financial markets than the more common Kalman filter, which assumes Gaussian noise
- The triple-measure efficiency assessment (R-squared linearity + dual-window chop + Kaufman efficiency) provides more robust regime detection than any single measure. Each captures a different aspect of market behavior
- The five-state classification with hysteresis persistence requirements produces stable, actionable regime labels rather than the flickering binary (trending/ranging) classifications common in simpler indicators
- Regime-adaptive volatility envelope scaling automatically adjusts band behavior to the detected market phase, providing context-appropriate support/resistance levels
- The composite signal strength score synthesizes all subsystems into a single conviction measure
- Regime shift boxes provide a visual record of market phase transitions that aids in pattern recognition across longer timeframes
Disclaimer
This indicator is provided for educational and informational purposes only. It is not financial advice or a recommendation to buy or sell any financial instrument. Trading involves substantial risk of loss. Regime classifications are based on historical data analysis and do not predict future market phases. A market classified as "Expansion Bull" can reverse at any time. Compression does not guarantee a subsequent breakout, and the direction of any breakout is not predicted by the compression classification. Always use proper risk management and conduct your own analysis. The author is not responsible for any losses incurred from using this indicator.
-Made with passion by officialjackofalltrades
Open-source Skript
Ganz im Sinne von TradingView hat dieser Autor sein/ihr Script als Open-Source veröffentlicht. Auf diese Weise können nun auch andere Trader das Script rezensieren und die Funktionalität überprüfen. Vielen Dank an den Autor! Sie können das Script kostenlos verwenden, aber eine Wiederveröffentlichung des Codes unterliegt unseren Hausregeln.

The AI Trading Ecosystem, Built to win trades 📈
Get Full Access 👇
jackofalltrades.vip 🌐
t.me/jackofalltradesvip 🃏
Get Full Access 👇
jackofalltrades.vip 🌐
t.me/jackofalltradesvip 🃏
Haftungsausschluss
Die Informationen und Veröffentlichungen sind nicht als Finanz-, Anlage-, Handels- oder andere Arten von Ratschlägen oder Empfehlungen gedacht, die von TradingView bereitgestellt oder gebilligt werden, und stellen diese nicht dar. Lesen Sie mehr in den Nutzungsbedingungen.
Open-source Skript
Ganz im Sinne von TradingView hat dieser Autor sein/ihr Script als Open-Source veröffentlicht. Auf diese Weise können nun auch andere Trader das Script rezensieren und die Funktionalität überprüfen. Vielen Dank an den Autor! Sie können das Script kostenlos verwenden, aber eine Wiederveröffentlichung des Codes unterliegt unseren Hausregeln.
The AI Trading Ecosystem, Built to win trades 📈
Get Full Access 👇
jackofalltrades.vip 🌐
t.me/jackofalltradesvip 🃏
Get Full Access 👇
jackofalltrades.vip 🌐
t.me/jackofalltradesvip 🃏
Haftungsausschluss
Die Informationen und Veröffentlichungen sind nicht als Finanz-, Anlage-, Handels- oder andere Arten von Ratschlägen oder Empfehlungen gedacht, die von TradingView bereitgestellt oder gebilligt werden, und stellen diese nicht dar. Lesen Sie mehr in den Nutzungsbedingungen.