OPEN-SOURCE SCRIPT
Aktualisiert Stocks: Financial Summary [invincible3]
Stocks: Financial Summary [invincible3]
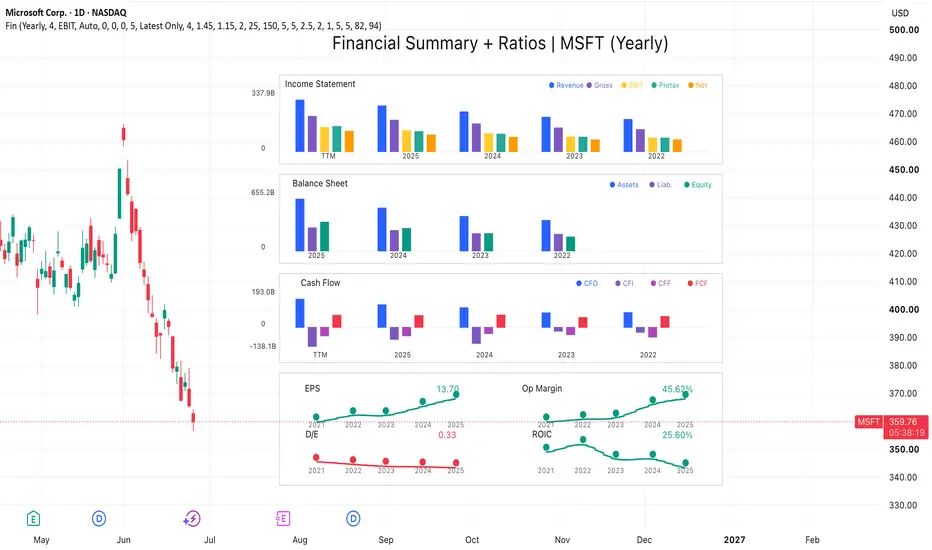
Stocks: Financial Summary is a compact fundamental dashboard designed to visualize a company’s key financial statements directly on the TradingView chart.
The indicator displays three major financial sections:
Income Statement
Revenue, Gross Profit, EBIT or Operating Income, Pretax Income, and Net Income.
Balance Sheet
Total Assets, Total Liabilities, and Shareholders’ Equity.
Cash Flow
Cash Flow from Operations, Cash Flow from Investing, Cash Flow from Financing, and Free Cash Flow.
The dashboard is drawn on the right side of the chart using a clean multi-panel bar-chart layout. It allows traders and investors to quickly compare historical yearly or quarterly financial data without leaving the price chart.
Key Features
* Supports Yearly and Quarterly financial views.
* Optional TTM display for Income Statement and Cash Flow.
* Visual comparison of historical financial periods.
* Auto unit formatting: Raw, K, M, B, and T.
* Customizable dashboard position, spacing, bar width, colors, and transparency.
* Right-side layout designed to keep the price chart readable.
* Uses actual TradingView financial data through `request.financial()`.
* Includes manual fiscal year and quarter override options when exchange reporting labels need adjustment.
This tool is designed for fundamental analysis, long-term stock screening, and quick financial statement comparison. It can help users visually inspect whether a company’s revenue, profitability, assets, liabilities, cash flow, and free cash flow are improving or weakening over time.
This indicator is for educational and informational purposes only. It is not financial advice.
Stocks: Financial Summary is a compact fundamental dashboard designed to visualize a company’s key financial statements directly on the TradingView chart.
The indicator displays three major financial sections:
Income Statement
Revenue, Gross Profit, EBIT or Operating Income, Pretax Income, and Net Income.
Balance Sheet
Total Assets, Total Liabilities, and Shareholders’ Equity.
Cash Flow
Cash Flow from Operations, Cash Flow from Investing, Cash Flow from Financing, and Free Cash Flow.
The dashboard is drawn on the right side of the chart using a clean multi-panel bar-chart layout. It allows traders and investors to quickly compare historical yearly or quarterly financial data without leaving the price chart.
Key Features
* Supports Yearly and Quarterly financial views.
* Optional TTM display for Income Statement and Cash Flow.
* Visual comparison of historical financial periods.
* Auto unit formatting: Raw, K, M, B, and T.
* Customizable dashboard position, spacing, bar width, colors, and transparency.
* Right-side layout designed to keep the price chart readable.
* Uses actual TradingView financial data through `request.financial()`.
* Includes manual fiscal year and quarter override options when exchange reporting labels need adjustment.
This tool is designed for fundamental analysis, long-term stock screening, and quick financial statement comparison. It can help users visually inspect whether a company’s revenue, profitability, assets, liabilities, cash flow, and free cash flow are improving or weakening over time.
This indicator is for educational and informational purposes only. It is not financial advice.
Versionshinweise
Added a new Ratios section to the Financial Summary dashboard. The update now includes mini trend cards for key financial ratios, including EPS, Operating Margin, Debt-to-Equity, and ROIC. Each ratio card shows historical yearly movement using compact curve visualization, year labels, dots, and latest value text.
The ratio section is designed to provide a quick view of profitability, leverage, and capital efficiency directly alongside the income statement, balance sheet, and cash flow panels. Layout handling was also improved so the financial statement sections and ratio cards fit together more cleanly on the right side of the chart.
Visual improvements include solid ratio curves, cleaner latest-value labels without background boxes, adjustable ratio curve width, and better spacing for readability.
Open-source Skript
Ganz im Sinne von TradingView hat dieser Autor sein/ihr Script als Open-Source veröffentlicht. Auf diese Weise können nun auch andere Trader das Script rezensieren und die Funktionalität überprüfen. Vielen Dank an den Autor! Sie können das Script kostenlos verwenden, aber eine Wiederveröffentlichung des Codes unterliegt unseren Hausregeln.

Haftungsausschluss
Die Informationen und Veröffentlichungen sind nicht als Finanz-, Anlage-, Handels- oder andere Arten von Ratschlägen oder Empfehlungen gedacht, die von TradingView bereitgestellt oder gebilligt werden, und stellen diese nicht dar. Lesen Sie mehr in den Nutzungsbedingungen.
Open-source Skript
Ganz im Sinne von TradingView hat dieser Autor sein/ihr Script als Open-Source veröffentlicht. Auf diese Weise können nun auch andere Trader das Script rezensieren und die Funktionalität überprüfen. Vielen Dank an den Autor! Sie können das Script kostenlos verwenden, aber eine Wiederveröffentlichung des Codes unterliegt unseren Hausregeln.
Haftungsausschluss
Die Informationen und Veröffentlichungen sind nicht als Finanz-, Anlage-, Handels- oder andere Arten von Ratschlägen oder Empfehlungen gedacht, die von TradingView bereitgestellt oder gebilligt werden, und stellen diese nicht dar. Lesen Sie mehr in den Nutzungsbedingungen.