Aktualisiert
Market Strategies - Strat Volume Bars
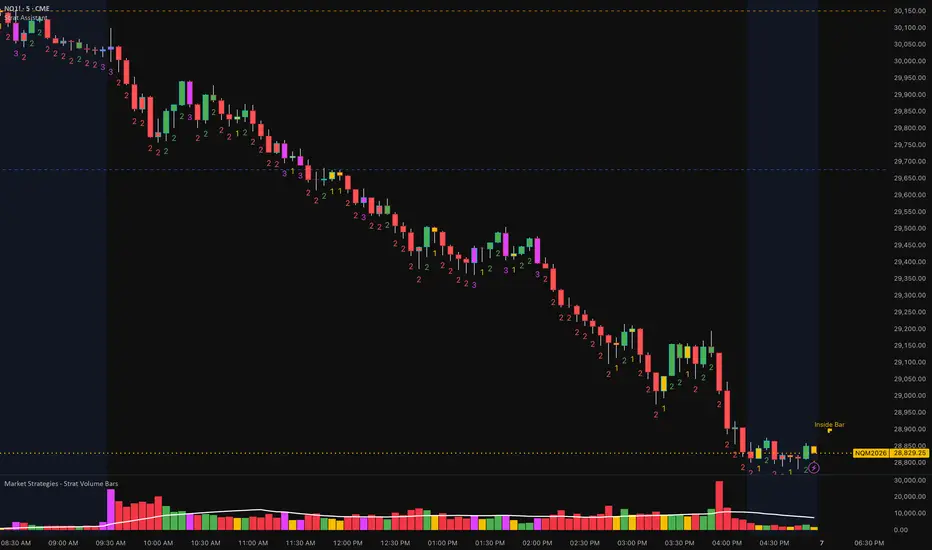
# Market Strategies – Strat Volume Bars
## Overview
Market Strategies – Strat Volume Bars brings The Strat directly into your volume analysis by color-coding every volume bar based on the candle's Strat classification.
Instead of viewing volume as a standalone metric, this indicator allows traders to instantly identify whether volume is occurring on an Inside Bar (1), Directional Up Bar (2U), Directional Down Bar (2D), or Outside Bar (3).
This provides a deeper layer of context by combining price action structure with volume participation.
---
## Strat Volume Classifications
### 🟨 Yellow Volume Bar – Inside Bar (1)
An Inside Bar occurs when the current candle remains completely inside the range of the previous candle.
**Interpretation:**
* Market compression
* Indecision
* Energy building
* Potential setup candle before expansion
High volume on an Inside Bar can indicate absorption or accumulation before a larger move develops.
---
### 🟩 Green Volume Bar – 2 Up
A 2 Up candle takes out the previous candle's high without taking out the previous candle's low.
**Interpretation:**
* Bullish directional movement
* Buyers in control
* Expansion to the upside
When accompanied by volume above the average volume line, it may signal strong participation behind the move.
---
### 🟥 Red Volume Bar – 2 Down
A 2 Down candle takes out the previous candle's low without taking out the previous candle's high.
**Interpretation:**
* Bearish directional movement
* Sellers in control
* Expansion to the downside
Higher-than-average volume on a 2 Down often suggests increased selling pressure.
---
### 🟪 Fuchsia Volume Bar – Outside Bar (3)
An Outside Bar takes out both the previous candle's high and low.
**Interpretation:**
* Volatility expansion
* Aggressive participation from both buyers and sellers
* Potential reversal or continuation
Large-volume Outside Bars often represent important decision points in the market.
---
## Average Volume Line
The indicator includes an optional moving average volume line to help identify abnormal participation.
### Volume Above Average
* Increased market interest
* Greater conviction
* Potential trend continuation
### Volume Below Average
* Reduced participation
* Lower conviction
* Higher probability of chop or failed moves
---
## How to Use
### Bullish Conditions
Look for:
* Green (2 Up) volume bars
* Volume above average
* Breaks of important market structure
* Alignment with higher timeframe direction
### Bearish Conditions
Look for:
* Red (2 Down) volume bars
* Volume above average
* Breaks below support or key levels
* Alignment with higher timeframe direction
### Compression Setups
Look for:
* Yellow (Inside Bar) volume bars
* Tight consolidation
* Followed by a directional 2 Up or 2 Down break
### Volatility Events
Look for:
* Fuchsia (Outside Bar) volume bars
* Significant volume spikes
* Confirmation from the next candle
---
## Key Benefits
✔ Instantly identify Strat candle types through volume
✔ Quickly spot volume-supported directional moves
✔ Easily distinguish compression from expansion
✔ Helps validate breakouts and breakdowns
✔ Works across all markets and timeframes
✔ Complements The Strat methodology without cluttering the chart
---
## Disclaimer
This indicator is designed as a market structure and volume visualization tool. It should be used alongside proper risk management, market context, and confirmation techniques. No indicator should be used as a standalone trading system.
Versionshinweise
AGGRESSION UPDATEThis update adds an estimated buying and selling aggression layer to the existing Strat Volume Bars indicator.
The original indicator classified each volume column according to its Strat candle type:
• Yellow: inside bar
• Green: directional 2-up bar
• Red: directional 2-down bar
• Fuchsia: outside bar
• Gray: unclassified or neutral condition
The new aggression logic does not replace this classification. Standard volume bars continue to use their original Strat colors unless a bar satisfies all the configured aggression requirements. When aggression is detected, bright green or bright red temporarily overrides the standard Strat color so the condition is immediately visible.
HOW AGGRESSION IS ESTIMATED
Because this version does not use bid/ask footprint data or seconds-based lower-timeframe requests, aggression is estimated from three chart-based measurements:
1. Relative Volume
The current bar’s volume is compared with its moving average. By default, volume must be at least 1.20 times the 20-bar average.
This requirement helps prevent ordinary low-participation candles from being classified as aggressive.
2. Candle-Body Strength
The candle body is measured as a percentage of the candle’s complete high-to-low range:
Body Strength = Absolute Value of Close - Open / High - Low × 100
A larger body percentage indicates that price moved directionally through a meaningful portion of the bar instead of producing mostly wick movement.
The default minimum body strength is 50%.
3. Closing Position
The closing price is measured within the candle’s complete range:
Close Position = Close - Low / High - Low × 100
A value near 100% means the candle closed near its high. A value near 0% means it closed near its low.
By default, estimated buying aggression requires a close in the upper 30% of the candle’s range. Estimated selling aggression requires a close in the lower 30%.
BUYING AGGRESSION
A bar is classified as estimated buying aggression when all of the following are true:
• Volume is above the selected relative-volume requirement.
• The candle closes above its open.
• The candle body meets the minimum body-strength requirement.
• The candle closes at or above the selected upper-range threshold.
Qualified bars are displayed in bright green and can optionally show a BUY marker.
SELLING AGGRESSION
A bar is classified as estimated selling aggression when all of the following are true:
• Volume is above the selected relative-volume requirement.
• The candle closes below its open.
• The candle body meets the minimum body-strength requirement.
• The candle closes at or below the corresponding lower-range threshold.
Qualified bars are displayed in bright red and can optionally show a SELL marker.
NEW USER INPUTS
Show Aggression enables or disables the aggression classification without removing the underlying Strat volume display.
Show Aggression Labels controls whether BUY and SELL markers appear on qualifying volume columns.
Aggression Volume vs Average determines how much current volume must exceed its moving average. Increasing this value produces fewer but more selective signals.
Close Position Threshold determines how near the high or low a candle must close. Increasing this value applies a stricter closing-location requirement.
Minimum Body Strength determines how much of the candle’s total range must consist of its real body. Increasing this value filters out more wick-dominated candles.
NEW ALERTS
Separate alert conditions have been added for estimated buying and selling aggression:
• Buy Aggression
• Sell Aggression
For confirmation-based use, alerts should generally be configured as “Once Per Bar Close.” A developing candle can stop qualifying before it closes if its price, range, or volume relationship changes.
DATA WINDOW ADDITIONS
The following values are now available in TradingView’s Data Window:
• Body Strength %
• Close Position %
• Relative Volume
These measurements allow users to inspect why a particular bar did or did not qualify as aggressive.
HOW TO INTERPRET THE UPDATE
An aggression signal means the bar combined elevated participation with directional candle structure and a strong closing location. It does not guarantee continuation.
Estimated buying aggression without additional upward price progress can indicate buying absorption or exhaustion. Estimated selling aggression without additional downward progress can indicate selling absorption or exhaustion.
Users should evaluate aggression together with the bar’s Strat classification, surrounding price structure, important levels, and subsequent price response.
IMPORTANT LIMITATION
This feature estimates aggression from OHLC price structure and total chart volume. It does not measure actual market-order execution at the bid or ask and should not be described as true order-flow delta, footprint imbalance, or verified buyer-versus-seller volume.
The purpose of the update is to identify unusually forceful price-and-volume bars while preserving the original Strat candle classification system.

Haftungsausschluss
Die Informationen und Veröffentlichungen sind nicht als Finanz-, Anlage-, Handels- oder andere Arten von Ratschlägen oder Empfehlungen gedacht, die von TradingView bereitgestellt oder gebilligt werden, und stellen diese nicht dar. Lesen Sie mehr in den Nutzungsbedingungen.
Haftungsausschluss
Die Informationen und Veröffentlichungen sind nicht als Finanz-, Anlage-, Handels- oder andere Arten von Ratschlägen oder Empfehlungen gedacht, die von TradingView bereitgestellt oder gebilligt werden, und stellen diese nicht dar. Lesen Sie mehr in den Nutzungsbedingungen.