TE ATR Regime Time of Day Conditioned Volatility Percentile
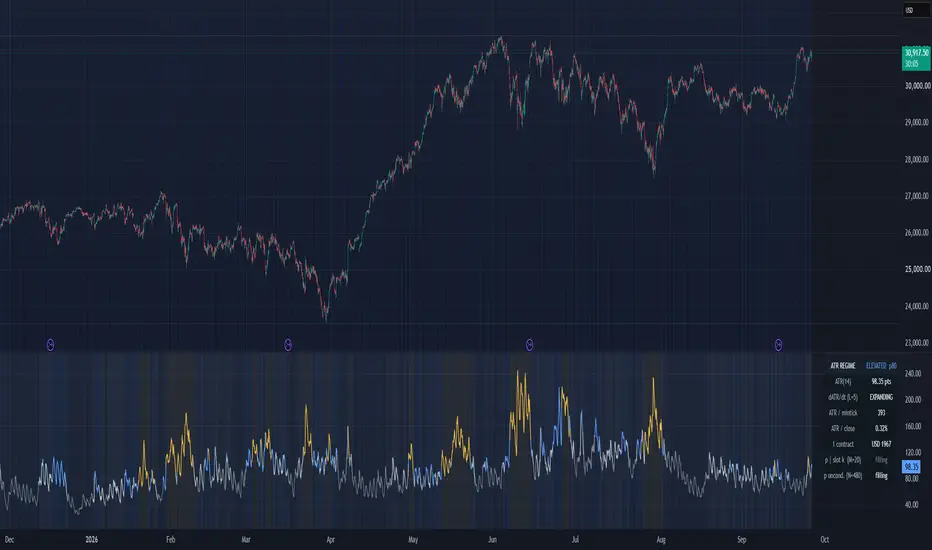
TE ATR Regime - Time-of-Day-Conditioned Volatility Percentile

Default parameters
TE ATR Regime is a volatility-context indicator built around a simple question:
How volatile is this market right now, and is that volatility expanding or contracting?

Traditional ATR reports the magnitude of recent range, but the raw value has no context. An ATR of 14 points may be unusually large at one time of day and completely ordinary at another.

This indicator keeps Wilder's ATR unchanged and adds two percentile estimators around it:
1. An unconditional percentile over recent bars.
2. A time-of-day-conditioned percentile comparing the current reading only with prior observations from the same intraday time slot.
The two estimates are displayed side by side so the user can see when a conventional trailing volatility percentile is primarily reflecting the normal rhythm of the trading day rather than an unusual volatility condition.

1. Average True Range
The underlying ATR is Wilder's standard Average True Range:
Pine Script®
The default is n = 14.
The plotted ATR is the standard Pine ta.atr(n) series. It is not replaced by a proprietary variation.
2. Volatility normalization
The current ATR is first normalized by price:
Pine Script®
This expresses volatility as a fraction of the instrument's current price instead of relying only on raw points.
The indicator then calculates two empirical percentile ranks:
Pine Script®
Defaults:
N = 480 closed bars
M = 20 prior slot observations
The intraday slot is:
Pine Script®
Time is evaluated using the instrument's own exchange timezone.
Percentile ranks use the mid-rank convention:
Pine Script®
A flat history therefore ranks at 0.50 rather than automatically returning 1.00.
The current bar is ranked against previously closed history before it is added to that history.
3. Volatility regime bands
The active percentile is translated into five descriptive volatility states:
COMPRESSED: p <= 0.20
SUBDUED: 0.20 < p <= 0.40
BASELINE: 0.40 < p <= 0.60
ELEVATED: 0.60 < p <= 0.80
EXPANDED: p > 0.80
These states describe relative range conditions only. They do not indicate bullish or bearish direction.
4. Hysteresis and dwell
Raw percentile classifications can alternate repeatedly when the reading sits near a band boundary.
TE ATR Regime therefore separates measurement from publication.
A new band must first clear the existing boundary by a hysteresis margin:
Pine Script®
The default hysteresis margin is 5 percentile points.
After clearing that threshold, the candidate state must remain valid for D consecutive confirmed bars before the new state is published.
Default:
D = 2 closed bars
These mechanisms serve different purposes:
Hysteresis reduces boundary chatter.
Dwell suppresses brief state excursions.

The tradeoff is explicit: greater state stability can introduce publication delay.
Setting delta_p = 0 and D = 1 exposes the raw classification behavior.
5. Volatility level and volatility change are separate
The indicator also measures the relative first difference of ATR:
Pine Script®
Defaults:
L = 5 bars
epsilon = 5%
Classification:
EXPANDING if r > +epsilon
CONTRACTING if r < -epsilon
STABLE otherwise
This deliberately separates two different questions:
How large is volatility relative to history?
And:
Is volatility currently increasing or decreasing?
A market can therefore be COMPRESSED and EXPANDING at the same time, or EXPANDED and CONTRACTING.
Why condition volatility on time of day?
The development research measured the difference using 1-minute ES and NQ futures data from June 2010 through June 2026, aggregated to 15-minute bars.
Across 745,589 rated bars, median ATR as a percentage of price varied materially across the trading day.
ES:
quietest-to-loudest median ATR/price ratio = 2.44x
NQ:
quietest-to-loudest median ATR/price ratio = 2.78x
The time-conditioned and unconditional estimators assigned different five-band states on approximately two-thirds of rated bars.
Because the estimators use different sample sizes, that raw disagreement cannot by itself be attributed to time of day. A same-sample-size control was therefore run with the time-of-day structure removed.
Control disagreement was approximately 29% for both instruments, versus approximately 66-67% for the actual time-conditioned comparison.
The remaining difference was approximately 37-38 percentage points in this ES/NQ sample.
This is a descriptive measurement of volatility structure. It is not a trading-performance result and makes no claim about future returns.
Readout
The full panel can display:
- ATR in price points
- ATR in minimum tick increments
- ATR as a percentage of price
- ATR translated into currency at a user-entered quantity
- Published volatility regime
- EXPANDING / STABLE / CONTRACTING state
- Time-of-day-conditioned percentile
- Unconditional percentile
Instrument metadata such as minimum tick, point value, currency and exchange timezone is read directly from the symbol.
The money row is arithmetic only:
Pine Script®
It is not connected to an account, broker, position or risk model.
Intraday behavior
Time-of-day conditioning is intended for intraday charts.
When a meaningful time-of-day comparison is unavailable, the indicator falls back to the unconditional percentile and identifies that condition in the panel rather than presenting the fallback as though it were the same measurement.
Closed-bar state logic
Published regime changes and alerts are evaluated on confirmed bars.
The ATR value itself can naturally change while the current bar is forming, but the published regime state does not change until bar confirmation.
The script does not use request.security() for higher-timeframe calculations.
Alerts
An alert condition is available when the published ATR regime changes.
Alerts are state-change events rather than every-bar notifications.
What this indicator does not do
It does not forecast price.
It does not forecast future volatility.
It does not provide bullish or bearish direction.
It does not generate a win rate, profit factor or trading-performance estimate.
It does not place stops or determine position size.
It does not connect to a brokerage account.
EXPANDED means recent volatility is high relative to the selected historical context. It does not mean volatility will remain high or that price will move in either direction.
ATR period n: 14
Slot sample depth M: 20 sessions
Unconditional window N: 480 bars
Hysteresis margin: 5 percentile points
Dwell D: 2 confirmed bars
Difference lag L: 5 bars
First-difference deadband: 5%
Position quantity q: 1
TE ATR Regime is designed as decision-support infrastructure: the classic ATR remains intact while the additional layers provide statistical context for interpreting what that ATR means for the instrument and time of day currently being observed.
Default parameters
TE ATR Regime is a volatility-context indicator built around a simple question:
How volatile is this market right now, and is that volatility expanding or contracting?
Traditional ATR reports the magnitude of recent range, but the raw value has no context. An ATR of 14 points may be unusually large at one time of day and completely ordinary at another.
This indicator keeps Wilder's ATR unchanged and adds two percentile estimators around it:
1. An unconditional percentile over recent bars.
2. A time-of-day-conditioned percentile comparing the current reading only with prior observations from the same intraday time slot.
The two estimates are displayed side by side so the user can see when a conventional trailing volatility percentile is primarily reflecting the normal rhythm of the trading day rather than an unusual volatility condition.
1. Average True Range
The underlying ATR is Wilder's standard Average True Range:
The default is n = 14.
The plotted ATR is the standard Pine ta.atr(n) series. It is not replaced by a proprietary variation.
2. Volatility normalization
The current ATR is first normalized by price:
This expresses volatility as a fraction of the instrument's current price instead of relying only on raw points.
The indicator then calculates two empirical percentile ranks:
Defaults:
N = 480 closed bars
M = 20 prior slot observations
The intraday slot is:
Time is evaluated using the instrument's own exchange timezone.
Percentile ranks use the mid-rank convention:
A flat history therefore ranks at 0.50 rather than automatically returning 1.00.
The current bar is ranked against previously closed history before it is added to that history.
3. Volatility regime bands
The active percentile is translated into five descriptive volatility states:
COMPRESSED: p <= 0.20
SUBDUED: 0.20 < p <= 0.40
BASELINE: 0.40 < p <= 0.60
ELEVATED: 0.60 < p <= 0.80
EXPANDED: p > 0.80
These states describe relative range conditions only. They do not indicate bullish or bearish direction.
4. Hysteresis and dwell
Raw percentile classifications can alternate repeatedly when the reading sits near a band boundary.
TE ATR Regime therefore separates measurement from publication.
A new band must first clear the existing boundary by a hysteresis margin:
The default hysteresis margin is 5 percentile points.
After clearing that threshold, the candidate state must remain valid for D consecutive confirmed bars before the new state is published.
Default:
D = 2 closed bars
These mechanisms serve different purposes:
Hysteresis reduces boundary chatter.
Dwell suppresses brief state excursions.
The tradeoff is explicit: greater state stability can introduce publication delay.
Setting delta_p = 0 and D = 1 exposes the raw classification behavior.
5. Volatility level and volatility change are separate
The indicator also measures the relative first difference of ATR:
Defaults:
L = 5 bars
epsilon = 5%
Classification:
EXPANDING if r > +epsilon
CONTRACTING if r < -epsilon
STABLE otherwise
This deliberately separates two different questions:
How large is volatility relative to history?
And:
Is volatility currently increasing or decreasing?
A market can therefore be COMPRESSED and EXPANDING at the same time, or EXPANDED and CONTRACTING.
Why condition volatility on time of day?
The development research measured the difference using 1-minute ES and NQ futures data from June 2010 through June 2026, aggregated to 15-minute bars.
Across 745,589 rated bars, median ATR as a percentage of price varied materially across the trading day.
ES:
quietest-to-loudest median ATR/price ratio = 2.44x
NQ:
quietest-to-loudest median ATR/price ratio = 2.78x
The time-conditioned and unconditional estimators assigned different five-band states on approximately two-thirds of rated bars.
Because the estimators use different sample sizes, that raw disagreement cannot by itself be attributed to time of day. A same-sample-size control was therefore run with the time-of-day structure removed.
Control disagreement was approximately 29% for both instruments, versus approximately 66-67% for the actual time-conditioned comparison.
The remaining difference was approximately 37-38 percentage points in this ES/NQ sample.
This is a descriptive measurement of volatility structure. It is not a trading-performance result and makes no claim about future returns.
Readout
The full panel can display:
- ATR in price points
- ATR in minimum tick increments
- ATR as a percentage of price
- ATR translated into currency at a user-entered quantity
- Published volatility regime
- EXPANDING / STABLE / CONTRACTING state
- Time-of-day-conditioned percentile
- Unconditional percentile
Instrument metadata such as minimum tick, point value, currency and exchange timezone is read directly from the symbol.
The money row is arithmetic only:
It is not connected to an account, broker, position or risk model.
Intraday behavior
Time-of-day conditioning is intended for intraday charts.
When a meaningful time-of-day comparison is unavailable, the indicator falls back to the unconditional percentile and identifies that condition in the panel rather than presenting the fallback as though it were the same measurement.
Closed-bar state logic
Published regime changes and alerts are evaluated on confirmed bars.
The ATR value itself can naturally change while the current bar is forming, but the published regime state does not change until bar confirmation.
The script does not use request.security() for higher-timeframe calculations.
Alerts
An alert condition is available when the published ATR regime changes.
Alerts are state-change events rather than every-bar notifications.
What this indicator does not do
It does not forecast price.
It does not forecast future volatility.
It does not provide bullish or bearish direction.
It does not generate a win rate, profit factor or trading-performance estimate.
It does not place stops or determine position size.
It does not connect to a brokerage account.
EXPANDED means recent volatility is high relative to the selected historical context. It does not mean volatility will remain high or that price will move in either direction.
ATR period n: 14
Slot sample depth M: 20 sessions
Unconditional window N: 480 bars
Hysteresis margin: 5 percentile points
Dwell D: 2 confirmed bars
Difference lag L: 5 bars
First-difference deadband: 5%
Position quantity q: 1
TE ATR Regime is designed as decision-support infrastructure: the classic ATR remains intact while the additional layers provide statistical context for interpreting what that ATR means for the instrument and time of day currently being observed.

Haftungsausschluss
Die Informationen und Veröffentlichungen sind nicht als Finanz-, Anlage-, Handels- oder andere Arten von Ratschlägen oder Empfehlungen gedacht, die von TradingView bereitgestellt oder gebilligt werden, und stellen diese nicht dar. Lesen Sie mehr in den Nutzungsbedingungen.
Haftungsausschluss
Die Informationen und Veröffentlichungen sind nicht als Finanz-, Anlage-, Handels- oder andere Arten von Ratschlägen oder Empfehlungen gedacht, die von TradingView bereitgestellt oder gebilligt werden, und stellen diese nicht dar. Lesen Sie mehr in den Nutzungsbedingungen.