True Footprint - Retail vs Institutional Delta Oscillator
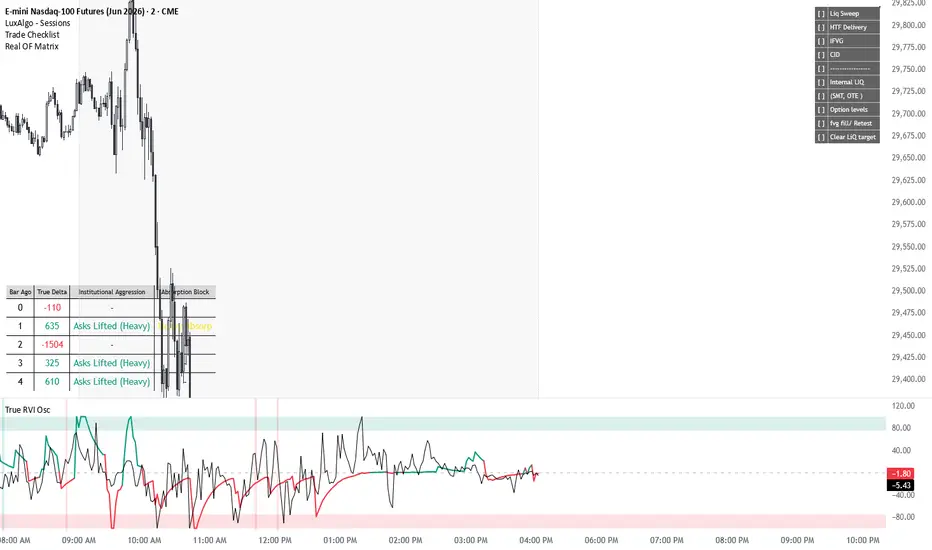
//version=6
indicator("True Footprint - Retail vs Institutional Delta Oscillator", shorttitle="True RVI Osc", overlay=false)
//--- Inputs ---
int_length = input.int(14, title="Institutional Smoothing Length", minval=1)
ret_length = input.int(5, title="Retail Tracking Length", minval=1)
inst_thres = input.float(1.3, title="Institutional Volume Threshold (x Avg)", step=0.1)
show_absorb = input.bool(true, title="Highlight Absorption Zones?")
//--- Core Calculations: True Footprint Data Feed ---
avg_volume = ta.sma(volume, 20)
// ⚡ CRITICAL UPGRADE: Pulling real server-side transaction data matching your matrix script
footprint fp = request.footprint(10, 70)
float true_delta = not na(fp) ? fp.delta() : ((close - open) / (high - low == 0 ? 1 : high - low)) * volume
//--- Separating Retail vs Institutional using True Data ---
float inst_raw = 0.0
float ret_raw = 0.0
// If the transaction volume spikes past the threshold, it is routed to Institutional Flow
if volume > (avg_volume * inst_thres)
inst_raw := true_delta
ret_raw := true_delta * 0.1
else
ret_raw := true_delta
inst_raw := true_delta * 0.05
// Apply individual smoothing to lines
inst_line = ta.ema(inst_raw, int_length)
ret_line = ta.ema(ret_raw, ret_length)
// Normalize values to fit beautifully on the fixed -100 to +100 scale
max_metric = ta.highest(math.max(math.abs(inst_line), math.abs(ret_line)), 100)
max_metric := max_metric == 0 or na(max_metric) ? 1 : max_metric
norm_inst = (inst_line / max_metric) * 100
norm_ret = (ret_line / max_metric) * 100
//--- Zones Highlighting (75 to 100 Green, -75 to -100 Red) ---
h_top = hline(100, title="Top Boundary", display=display.none)
h_zone_g = hline(75, title="Buy Zone Lower", display=display.none)
h_zero = hline(0, title="Zero Line", color=color.new(color.gray, 50), linestyle=hline.style_dashed)
h_zone_r = hline(-75, title="Sell Zone Upper", display=display.none)
h_bot = hline(-100, title="Bottom Boundary", display=display.none)
fill(h_top, h_zone_g, color=color.new(#089981, 85), title="Buy Zone Highlight")
fill(h_bot, h_zone_r, color=color.new(#f23645, 85), title="Sell Zone Highlight")
//--- Plotting the Oscillator Lines ---
// Institutional Line (Thick, changes color based on zero line cross)
plot(norm_inst, title="Institutional Flow Line", color=norm_inst >= 0 ? #089981 : #f23645, linewidth=2)
// Retail Line (Thin Cyan Line)
plot(norm_ret, title="Retail Flow Line", color=color.aqua, linewidth=1)
//--- Advanced Logic: Footprint Absorption Detection ---
bull_absorb = (norm_ret < -20) and (norm_inst > 10) and (close >= open)
bear_absorb = (norm_ret > 20) and (norm_inst < -10) and (close <= open)
bg_color = show_absorb ? (bull_absorb ? color.new(#089981, 85) : (bear_absorb ? color.new(#f23645, 85) : na)) : na
bgcolor(bg_color, title="Absorption Highlight Zones")
//--- Alert Configurations ---
if bull_absorb
alert("Alert: True Footprint Bullish Absorption detected!", alert.freq_once_per_bar)
if bear_absorb
alert("Alert: True Footprint Bearish Absorption detected!", alert.freq_once_per_bar)
indicator("True Footprint - Retail vs Institutional Delta Oscillator", shorttitle="True RVI Osc", overlay=false)
//--- Inputs ---
int_length = input.int(14, title="Institutional Smoothing Length", minval=1)
ret_length = input.int(5, title="Retail Tracking Length", minval=1)
inst_thres = input.float(1.3, title="Institutional Volume Threshold (x Avg)", step=0.1)
show_absorb = input.bool(true, title="Highlight Absorption Zones?")
//--- Core Calculations: True Footprint Data Feed ---
avg_volume = ta.sma(volume, 20)
// ⚡ CRITICAL UPGRADE: Pulling real server-side transaction data matching your matrix script
footprint fp = request.footprint(10, 70)
float true_delta = not na(fp) ? fp.delta() : ((close - open) / (high - low == 0 ? 1 : high - low)) * volume
//--- Separating Retail vs Institutional using True Data ---
float inst_raw = 0.0
float ret_raw = 0.0
// If the transaction volume spikes past the threshold, it is routed to Institutional Flow
if volume > (avg_volume * inst_thres)
inst_raw := true_delta
ret_raw := true_delta * 0.1
else
ret_raw := true_delta
inst_raw := true_delta * 0.05
// Apply individual smoothing to lines
inst_line = ta.ema(inst_raw, int_length)
ret_line = ta.ema(ret_raw, ret_length)
// Normalize values to fit beautifully on the fixed -100 to +100 scale
max_metric = ta.highest(math.max(math.abs(inst_line), math.abs(ret_line)), 100)
max_metric := max_metric == 0 or na(max_metric) ? 1 : max_metric
norm_inst = (inst_line / max_metric) * 100
norm_ret = (ret_line / max_metric) * 100
//--- Zones Highlighting (75 to 100 Green, -75 to -100 Red) ---
h_top = hline(100, title="Top Boundary", display=display.none)
h_zone_g = hline(75, title="Buy Zone Lower", display=display.none)
h_zero = hline(0, title="Zero Line", color=color.new(color.gray, 50), linestyle=hline.style_dashed)
h_zone_r = hline(-75, title="Sell Zone Upper", display=display.none)
h_bot = hline(-100, title="Bottom Boundary", display=display.none)
fill(h_top, h_zone_g, color=color.new(#089981, 85), title="Buy Zone Highlight")
fill(h_bot, h_zone_r, color=color.new(#f23645, 85), title="Sell Zone Highlight")
//--- Plotting the Oscillator Lines ---
// Institutional Line (Thick, changes color based on zero line cross)
plot(norm_inst, title="Institutional Flow Line", color=norm_inst >= 0 ? #089981 : #f23645, linewidth=2)
// Retail Line (Thin Cyan Line)
plot(norm_ret, title="Retail Flow Line", color=color.aqua, linewidth=1)
//--- Advanced Logic: Footprint Absorption Detection ---
bull_absorb = (norm_ret < -20) and (norm_inst > 10) and (close >= open)
bear_absorb = (norm_ret > 20) and (norm_inst < -10) and (close <= open)
bg_color = show_absorb ? (bull_absorb ? color.new(#089981, 85) : (bear_absorb ? color.new(#f23645, 85) : na)) : na
bgcolor(bg_color, title="Absorption Highlight Zones")
//--- Alert Configurations ---
if bull_absorb
alert("Alert: True Footprint Bullish Absorption detected!", alert.freq_once_per_bar)
if bear_absorb
alert("Alert: True Footprint Bearish Absorption detected!", alert.freq_once_per_bar)

Haftungsausschluss
Die Informationen und Veröffentlichungen sind nicht als Finanz-, Anlage-, Handels- oder andere Arten von Ratschlägen oder Empfehlungen gedacht, die von TradingView bereitgestellt oder gebilligt werden, und stellen diese nicht dar. Lesen Sie mehr in den Nutzungsbedingungen.
Haftungsausschluss
Die Informationen und Veröffentlichungen sind nicht als Finanz-, Anlage-, Handels- oder andere Arten von Ratschlägen oder Empfehlungen gedacht, die von TradingView bereitgestellt oder gebilligt werden, und stellen diese nicht dar. Lesen Sie mehr in den Nutzungsbedingungen.