Aktualisiert
Open Legacy Scoreboard Official
Open Legacy Scoreboard Official
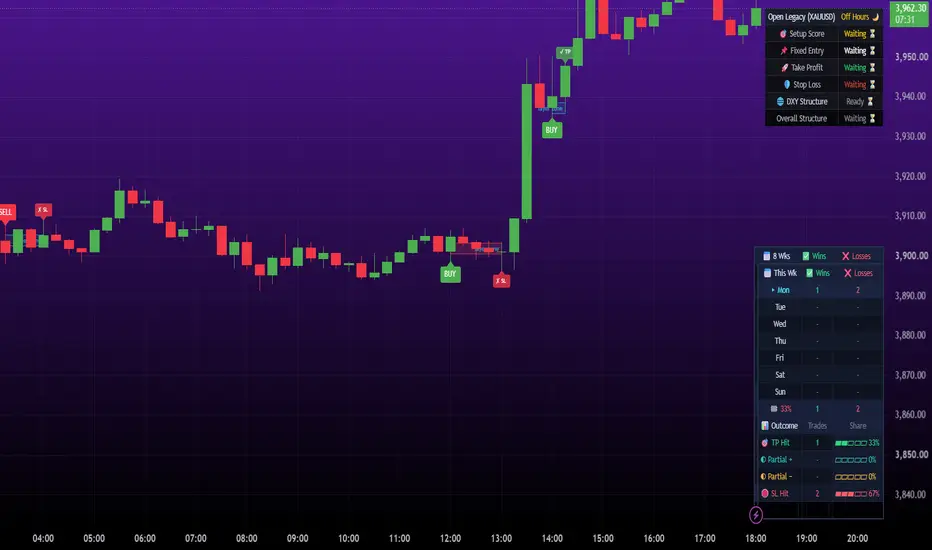
The Scoreboard lets you test your settings before you trust them. It replays the Open Legacy Official signals across your chart's history and scores each one, so you can see how a set of settings behaved on the data you have loaded.
What you will see
- A weekly table with wins and losses for Monday to Sunday, and a total win percentage.
- An outcome breakdown: TP Hit, Partial + (closed early in profit), Partial - (closed early at a loss) and SL Hit, each with a count and a share bar.
- Optional markers on the chart for each scored trade.
- A results period you can change, such as this week or the last 4 weeks. How far back you can go depends on the history your chart has loaded.
Getting set up
1. Add it to the same chart as Open Legacy Official.
2. Copy the same settings across: Entry Method, Sensitivity, SL, TP, Points Per Pip, sessions and timezone. When both match, they show the same trades.
3. Change one setting at a time and watch the table update. The whole history is scored again each time.
Using it well
- Look at the number of trades as well as the win rate. A few trades prove very little.
- Compare more than one period, for example the last 4 weeks against a longer one.
- Be careful about tuning settings to fit one stretch of history. A result that looks perfect in the past may not hold later.
How it scores
It uses the same rules as Open Legacy Official: one trade at a time, entry at the signal candle's close, and TP and SL checked against each candle's high and low. An opposite signal ends the trade early, which is counted as a Partial. Spread, commission and slippage are not included, and real fills will differ.
Please use standard candles only.
This is a charting tool, not investment advice. Past results do not predict future results, and trading carries risk of loss.
The Scoreboard lets you test your settings before you trust them. It replays the Open Legacy Official signals across your chart's history and scores each one, so you can see how a set of settings behaved on the data you have loaded.
What you will see
- A weekly table with wins and losses for Monday to Sunday, and a total win percentage.
- An outcome breakdown: TP Hit, Partial + (closed early in profit), Partial - (closed early at a loss) and SL Hit, each with a count and a share bar.
- Optional markers on the chart for each scored trade.
- A results period you can change, such as this week or the last 4 weeks. How far back you can go depends on the history your chart has loaded.
Getting set up
1. Add it to the same chart as Open Legacy Official.
2. Copy the same settings across: Entry Method, Sensitivity, SL, TP, Points Per Pip, sessions and timezone. When both match, they show the same trades.
3. Change one setting at a time and watch the table update. The whole history is scored again each time.
Using it well
- Look at the number of trades as well as the win rate. A few trades prove very little.
- Compare more than one period, for example the last 4 weeks against a longer one.
- Be careful about tuning settings to fit one stretch of history. A result that looks perfect in the past may not hold later.
How it scores
It uses the same rules as Open Legacy Official: one trade at a time, entry at the signal candle's close, and TP and SL checked against each candle's high and low. An opposite signal ends the trade early, which is counted as a Partial. Spread, commission and slippage are not included, and real fills will differ.
Please use standard candles only.
This is a charting tool, not investment advice. Past results do not predict future results, and trading carries risk of loss.
Versionshinweise
Added connection feature between open legacy layer master and scoreboardVersionshinweise
Finishing connection between open legacy layer master and scoreboard
Haftungsausschluss
Die Informationen und Veröffentlichungen sind nicht als Finanz-, Anlage-, Handels- oder andere Arten von Ratschlägen oder Empfehlungen gedacht, die von TradingView bereitgestellt oder gebilligt werden, und stellen diese nicht dar. Lesen Sie mehr in den Nutzungsbedingungen.
Haftungsausschluss
Die Informationen und Veröffentlichungen sind nicht als Finanz-, Anlage-, Handels- oder andere Arten von Ratschlägen oder Empfehlungen gedacht, die von TradingView bereitgestellt oder gebilligt werden, und stellen diese nicht dar. Lesen Sie mehr in den Nutzungsbedingungen.