Price Reaction Memory Heatmap [tradewsamet]
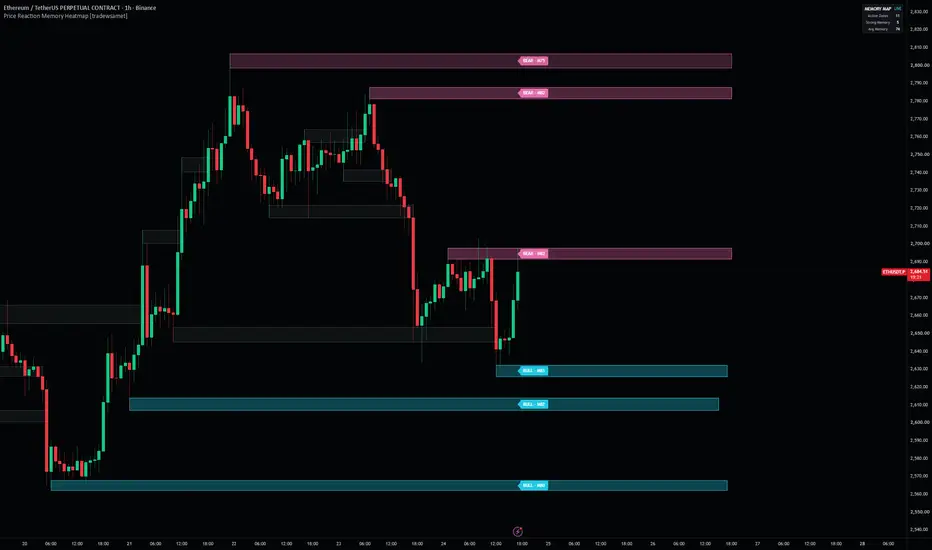
🎯 Price Reaction Memory Heatmap is an overlay indicator that turns confirmed price reactions into stateful memory zones and continuously re-evaluates how much reaction memory each zone still retains.
Ever marked a clean reaction area, only to find that it looked just as important after dozens of bars, repeated retests, deeper penetration and weaker responses? Most zone tools are good at showing where price reacted, but much less explicit about whether that reaction still carries the same relevance now.
The core idea: a reaction zone should not keep the same importance forever. Once a reaction is qualified, its memory can decay, reinforce, weaken, deplete or become structurally invalid as new price behavior interacts with it.
📊 OVERVIEW
A confirmed pivot is only the beginning. It becomes a Memory Zone only after price produces a sufficiently large ATR-normalized directional reaction within the qualification window.
Once active, the zone becomes a persistent object with its own history. The script tracks its age, distinct retests, penetration depth, post-touch reaction strength and completed interaction outcomes. Those variables are used to update the same zone state rather than acting as separate confirmation indicators.
The result is a Bullish or Bearish Memory Zone with a descriptive 0-100 Memory Score and lifecycle state.
The key question is:
Does this confirmed reaction still matter now?
Memory Score is not a probability, win rate or trade recommendation. It describes the current historical state of the zone according to the model.
🧩 WHY THESE COMPONENTS WORK TOGETHER
Traditional swing and zone tools answer "where did price react?", but that alone does not answer "how strong was the reaction?", "how much has the zone been consumed?", "has it survived repeated interaction?" or "does it still deserve the same visual importance?".
Price Reaction Memory Heatmap links those questions into one lifecycle:
Pivot confirmation → Reaction qualification → Memory zone → Retest history → Penetration damage → Time decay → Reinforcement / weakening → Memory Score → Lifecycle retirement
Reaction qualification prevents every local swing from becoming a zone. Retest history records repeated interaction. Penetration measures structural damage inside the zone. Time decay reduces stale memory. Completed reactions can reinforce or weaken accumulated evidence. The Memory Score summarizes the current state, and lifecycle rules determine when the zone remains active, fades, depletes or becomes structurally invalid.
Without qualification, every swing would become a zone. Without penetration tracking, a shallow retest and a full traversal would look the same. Without decay, old reactions could remain important indefinitely. Without reinforcement and weakening, new behavior could not update the original evidence.
ATR is used only as a scale-normalization unit for reaction distance, zone depth, spacing and invalidation distance. It does not determine Bullish/Bearish direction and is not used as a separate confirmation signal.
🔍 WHAT MAKES THIS MODEL ORIGINAL
1️⃣ Qualified reactions — not raw pivots
A confirmed pivot does not automatically become a memory zone.
With the default 3-left / 3-right pivot structure, the pivot is known only after the required right-side bars have completed. The candidate then has a limited qualification window and, by default, must produce at least a 2.00 ATR directional reaction within 20 completed bars.
— Bullish candidate: confirmed pivot low → sufficient upward excursion
— Bearish candidate: confirmed pivot high → sufficient downward excursion
— Failed candidate: qualification window ends without the required reaction
Why it matters: the script stores areas that demonstrated measurable reaction instead of treating every local swing as equally important.
2️⃣ Persistent zone memory — each zone keeps its own history
A new touch is counted only when price moves from outside the zone to inside it. Several consecutive bars inside the same zone belong to one interaction rather than being counted as multiple retests.
Each active zone records:
— distinct retest count
— first and most recent interaction
— deepest historical penetration
— current and completed post-touch reaction
— reinforced, neutral and weakened interaction counts
Why it matters: the zone is evaluated through accumulated behavior instead of a static touch count.
3️⃣ Penetration as structural damage
Penetration is normalized to the physical depth of the zone and capped at 100%.
— 0% = price has only reached the near side
— 100% = price has traversed the full zone depth
A move beyond the far edge is not represented as 200%, 400% or another unbounded value. Structural failure is handled separately by the lifecycle engine.
Why it matters: penetration remains interpretable across zones while structural invalidation stays a separate event.
4️⃣ Memory can decay, reinforce or weaken
The model does not assume that a zone becomes weaker only because time passes.
Age, repeated retests and penetration create natural memory decay. Completed interactions can then update the evidence:
— REINFORCED — a sufficiently strong post-touch reaction occurred without excessive penetration
— NEUTRAL — the interaction met neither reinforcement nor weakening conditions
— WEAKENED — price penetrated deeply and failed to produce sufficient post-touch reaction
Why it matters: new price behavior can strengthen or damage the zone's evidence instead of leaving the original reaction frozen forever.
5️⃣ One 0-100 Memory Score — five state variables
Each active zone receives a bounded Memory Score built from five components:
— Reaction Quality — 25%
— Freshness — 20%
— Retest Resilience — 15%
— Zone Integrity — 20%
— Outcome Evidence — 20%
Conceptually:
Memory Score =
Reaction Quality × 0.25
+ Freshness × 0.20
+ Retest Resilience × 0.15
+ Zone Integrity × 0.20
+ Outcome Evidence × 0.20
Score bands:
— 80-100 → STRONG
— 60-79 → ACTIVE
— 40-59 → WEAKENING
— 20-39 → FADING
— 0-19 → DEPLETED
Why it matters: the visible score is tied to explicit variables from the same zone lifecycle rather than to an unexplained ranking.
A score of 80 does not mean there is an 80% probability that price will react again.
6️⃣ Memory depletion ≠ structural invalidation
A zone can still carry a relatively high Memory Score and then become structurally invalidated by a confirmed close beyond its far edge.
Structural invalidation uses the configured ATR buffer; the default is 0.10 ATR.
Memory depletion is different. It occurs when the descriptive score falls into the depleted range after the configured minimum age; by default, depletion retirement can begin after 30 bars.
Why it matters: historical reaction strength and present structural validity are treated as different properties.
🧠 HOW IT WORKS — CALCULATION FLOW
Step 1 — Pivot confirmation: the script waits for the configured left/right pivot structure to be confirmed. With the default 3/3 setting, the pivot is known three right-side bars after its extreme.
Step 2 — Candidate creation: the confirmed pivot becomes a Bullish or Bearish reaction candidate.
Step 3 — Reaction qualification: directional excursion is measured in ATR units during the qualification window. A candidate that reaches the threshold becomes a Memory Zone; otherwise it expires.
Step 4 — Zone-quality filtering: same-side candidates that are too close in price or born too close together are filtered to reduce duplicate zones. The default configuration also limits the number of active zones.
Step 5 — Interaction tracking: the script detects outside-to-inside retests, measures penetration and starts a post-touch reaction cycle.
Step 6 — Interaction classification: the completed cycle is classified as Reinforced, Neutral or Weakened using the configured reaction and penetration thresholds.
Step 7 — Memory update: age, repeated interaction, penetration and accumulated outcome evidence update the zone state.
Step 8 — Memory Score: Reaction Quality, Freshness, Retest Resilience, Zone Integrity and Outcome Evidence are combined into the current 0-100 score.
Step 9 — Lifecycle decision: the zone remains active, fades, depletes or becomes structurally invalidated. Terminal zones stop behaving as active memory objects and can optionally remain as archived context.
📖 HOW TO USE
🎯 Quick start:
1. Add the indicator with the default settings.
2. Read the location of the zone first.
3. Read its Memory Score second.
4. Check whether the zone is Active, Reinforced, Weakening, Fading or Depleted.
5. Use the map as analytical context rather than an automatic entry instruction.
👁️ Reading the chart:
— Bullish memory zones originate from qualified reactions at confirmed pivot lows
— Bearish memory zones originate from qualified reactions at confirmed pivot highs
— BULL / BEAR badges show direction and the current Memory Score
— ✅ = reinforced memory
— ⚠️ = weakening memory
— ❌ = fading or depleted memory
— stronger zones remain visually dominant
— weaker zones use a softer palette
— archived zones are historical context, not active memory objects
📊 Memory Map panel:
— Active Zones
— Strong Memory
— Average Memory Score
🔧 Display controls:
— Both / Bullish Only / Bearish Only
— minimum displayed Memory Score
— Compact / Full / Off badge mode
— Dark / Light theme
— optional archived badges
— optional advanced candidate diagnostics
🎨 VISUALS
Active maps use a constant forward display horizon. The default is 50 bars.
As each new bar forms, the right edge advances by one bar so the map keeps the same forward distance from the current bar.
This is a display convention only. It does not mean the script predicts that price will visit, respect or react from the zone during the next 50 bars.
⚙️ KEY SETTINGS
⚙️ Reaction structure:
— Pivot Left / Right: default 3 / 3
— Qualification Window: default 20 bars
— Minimum Reaction: default 2.00 ATR
— Zone Depth: default 0.30 ATR
🧹 Zone quality:
— Same-Side Merge Distance: default 0.50 ATR
— Minimum Same-Side Birth Spacing: default 8 bars
— Maximum Active Zones: default 12
🧠 Memory model:
— Time Decay Lookback: default 120 bars
— Touch Decay Weight: controls repeated-interaction decay
— Penetration Damage Weight: controls structural damage from penetration
— Reaction Evaluation Window: default 12 bars
— Reinforcement / weakening thresholds: define how completed retests modify evidence
♻️ Lifecycle:
— Structural Invalidation Buffer: default 0.10 ATR
— Minimum Age Before Depletion: default 30 bars
— archived zones can remain visible after retirement
🎨 Visual settings:
— Theme: Dark / Light
— Map Projection Bars: default 50
— Status Emoji: optional
— Badge Mode: Compact / Full / Off
🎚️ Production controls:
— Active Side Filter: Both / Bullish Only / Bearish Only
— Minimum Displayed Score: visual filter only; hidden zones continue to be tracked internally
🔔 ALERTS
The script provides confirmed-bar alert conditions for:
— Memory Zone Touch
— Strong Memory Zone Touch
— Memory Zone Reinforced
— Memory Zone Invalidated
— New Strong Memory Zone
— Any Price Reaction Memory Alert
The script also supports TradingView's "Any alert() function call" workflow for a combined dynamic event stream when enabled in settings.
Alerts describe changes in the reaction-memory model. They are not automated trade instructions.
⚠️ IMPORTANT NOTES
— ⏳ Pivot confirmation is delayed by design. A pivot is only known after the configured right-side bars have completed.
— 🕰️ Historical zone origin is not realtime availability. After qualification, a zone can be drawn from its original pivot location for historical context. That does not mean the zone was known on that pivot bar; the pivot first required confirmation and the reaction then had to qualify.
— 📐 Post-touch reaction excludes the touch bar. Standard OHLC data does not reveal whether the favorable extreme of that candle occurred before or after the zone interaction, so reaction measurement begins after the touch bar.
— 🧮 Memory Score is not probability. It does not represent expected return, win rate, signal accuracy or the probability that a zone will hold.
— 🧱 Structural invalidation uses confirmed closes. A wick can penetrate deeply and damage Zone Integrity without automatically invalidating the zone.
— ↔️ The forward map is not a forecast. Projection length controls visual display only.
— 🗃️ Archived zones are historical context. Once retired, they no longer participate as active memory objects.
— 🌐 Zone density will differ across markets and timeframes. The model uses local ATR normalization rather than being tuned to one specific instrument.
— ⚡ Fast markets, gaps, session transitions, low-liquidity conditions and large volatility changes can cause zones to qualify, weaken, deplete or invalidate quickly.
— 🛠️ Changing model settings changes the meaning and lifecycle of the zones. Tighter settings do not automatically make the output more reliable.
🛡️ DISCLAIMER
This script is provided for educational and analytical purposes. It does not provide financial advice or guarantee future market behavior.
Bullish/Bearish classifications, Memory Scores, reaction zones, lifecycle states, status markers and alerts describe the script's internal model only. They should be evaluated together with the user's own analysis, risk management and understanding of market conditions.
Ever marked a clean reaction area, only to find that it looked just as important after dozens of bars, repeated retests, deeper penetration and weaker responses? Most zone tools are good at showing where price reacted, but much less explicit about whether that reaction still carries the same relevance now.
The core idea: a reaction zone should not keep the same importance forever. Once a reaction is qualified, its memory can decay, reinforce, weaken, deplete or become structurally invalid as new price behavior interacts with it.
📊 OVERVIEW
A confirmed pivot is only the beginning. It becomes a Memory Zone only after price produces a sufficiently large ATR-normalized directional reaction within the qualification window.
Once active, the zone becomes a persistent object with its own history. The script tracks its age, distinct retests, penetration depth, post-touch reaction strength and completed interaction outcomes. Those variables are used to update the same zone state rather than acting as separate confirmation indicators.
The result is a Bullish or Bearish Memory Zone with a descriptive 0-100 Memory Score and lifecycle state.
The key question is:
Does this confirmed reaction still matter now?
Memory Score is not a probability, win rate or trade recommendation. It describes the current historical state of the zone according to the model.
🧩 WHY THESE COMPONENTS WORK TOGETHER
Traditional swing and zone tools answer "where did price react?", but that alone does not answer "how strong was the reaction?", "how much has the zone been consumed?", "has it survived repeated interaction?" or "does it still deserve the same visual importance?".
Price Reaction Memory Heatmap links those questions into one lifecycle:
Pivot confirmation → Reaction qualification → Memory zone → Retest history → Penetration damage → Time decay → Reinforcement / weakening → Memory Score → Lifecycle retirement
Reaction qualification prevents every local swing from becoming a zone. Retest history records repeated interaction. Penetration measures structural damage inside the zone. Time decay reduces stale memory. Completed reactions can reinforce or weaken accumulated evidence. The Memory Score summarizes the current state, and lifecycle rules determine when the zone remains active, fades, depletes or becomes structurally invalid.
Without qualification, every swing would become a zone. Without penetration tracking, a shallow retest and a full traversal would look the same. Without decay, old reactions could remain important indefinitely. Without reinforcement and weakening, new behavior could not update the original evidence.
ATR is used only as a scale-normalization unit for reaction distance, zone depth, spacing and invalidation distance. It does not determine Bullish/Bearish direction and is not used as a separate confirmation signal.
🔍 WHAT MAKES THIS MODEL ORIGINAL
1️⃣ Qualified reactions — not raw pivots
A confirmed pivot does not automatically become a memory zone.
With the default 3-left / 3-right pivot structure, the pivot is known only after the required right-side bars have completed. The candidate then has a limited qualification window and, by default, must produce at least a 2.00 ATR directional reaction within 20 completed bars.
— Bullish candidate: confirmed pivot low → sufficient upward excursion
— Bearish candidate: confirmed pivot high → sufficient downward excursion
— Failed candidate: qualification window ends without the required reaction
Why it matters: the script stores areas that demonstrated measurable reaction instead of treating every local swing as equally important.
2️⃣ Persistent zone memory — each zone keeps its own history
A new touch is counted only when price moves from outside the zone to inside it. Several consecutive bars inside the same zone belong to one interaction rather than being counted as multiple retests.
Each active zone records:
— distinct retest count
— first and most recent interaction
— deepest historical penetration
— current and completed post-touch reaction
— reinforced, neutral and weakened interaction counts
Why it matters: the zone is evaluated through accumulated behavior instead of a static touch count.
3️⃣ Penetration as structural damage
Penetration is normalized to the physical depth of the zone and capped at 100%.
— 0% = price has only reached the near side
— 100% = price has traversed the full zone depth
A move beyond the far edge is not represented as 200%, 400% or another unbounded value. Structural failure is handled separately by the lifecycle engine.
Why it matters: penetration remains interpretable across zones while structural invalidation stays a separate event.
4️⃣ Memory can decay, reinforce or weaken
The model does not assume that a zone becomes weaker only because time passes.
Age, repeated retests and penetration create natural memory decay. Completed interactions can then update the evidence:
— REINFORCED — a sufficiently strong post-touch reaction occurred without excessive penetration
— NEUTRAL — the interaction met neither reinforcement nor weakening conditions
— WEAKENED — price penetrated deeply and failed to produce sufficient post-touch reaction
Why it matters: new price behavior can strengthen or damage the zone's evidence instead of leaving the original reaction frozen forever.
5️⃣ One 0-100 Memory Score — five state variables
Each active zone receives a bounded Memory Score built from five components:
— Reaction Quality — 25%
— Freshness — 20%
— Retest Resilience — 15%
— Zone Integrity — 20%
— Outcome Evidence — 20%
Conceptually:
Memory Score =
Reaction Quality × 0.25
+ Freshness × 0.20
+ Retest Resilience × 0.15
+ Zone Integrity × 0.20
+ Outcome Evidence × 0.20
Score bands:
— 80-100 → STRONG
— 60-79 → ACTIVE
— 40-59 → WEAKENING
— 20-39 → FADING
— 0-19 → DEPLETED
Why it matters: the visible score is tied to explicit variables from the same zone lifecycle rather than to an unexplained ranking.
A score of 80 does not mean there is an 80% probability that price will react again.
6️⃣ Memory depletion ≠ structural invalidation
A zone can still carry a relatively high Memory Score and then become structurally invalidated by a confirmed close beyond its far edge.
Structural invalidation uses the configured ATR buffer; the default is 0.10 ATR.
Memory depletion is different. It occurs when the descriptive score falls into the depleted range after the configured minimum age; by default, depletion retirement can begin after 30 bars.
Why it matters: historical reaction strength and present structural validity are treated as different properties.
🧠 HOW IT WORKS — CALCULATION FLOW
Step 1 — Pivot confirmation: the script waits for the configured left/right pivot structure to be confirmed. With the default 3/3 setting, the pivot is known three right-side bars after its extreme.
Step 2 — Candidate creation: the confirmed pivot becomes a Bullish or Bearish reaction candidate.
Step 3 — Reaction qualification: directional excursion is measured in ATR units during the qualification window. A candidate that reaches the threshold becomes a Memory Zone; otherwise it expires.
Step 4 — Zone-quality filtering: same-side candidates that are too close in price or born too close together are filtered to reduce duplicate zones. The default configuration also limits the number of active zones.
Step 5 — Interaction tracking: the script detects outside-to-inside retests, measures penetration and starts a post-touch reaction cycle.
Step 6 — Interaction classification: the completed cycle is classified as Reinforced, Neutral or Weakened using the configured reaction and penetration thresholds.
Step 7 — Memory update: age, repeated interaction, penetration and accumulated outcome evidence update the zone state.
Step 8 — Memory Score: Reaction Quality, Freshness, Retest Resilience, Zone Integrity and Outcome Evidence are combined into the current 0-100 score.
Step 9 — Lifecycle decision: the zone remains active, fades, depletes or becomes structurally invalidated. Terminal zones stop behaving as active memory objects and can optionally remain as archived context.
📖 HOW TO USE
🎯 Quick start:
1. Add the indicator with the default settings.
2. Read the location of the zone first.
3. Read its Memory Score second.
4. Check whether the zone is Active, Reinforced, Weakening, Fading or Depleted.
5. Use the map as analytical context rather than an automatic entry instruction.
👁️ Reading the chart:
— Bullish memory zones originate from qualified reactions at confirmed pivot lows
— Bearish memory zones originate from qualified reactions at confirmed pivot highs
— BULL / BEAR badges show direction and the current Memory Score
— ✅ = reinforced memory
— ⚠️ = weakening memory
— ❌ = fading or depleted memory
— stronger zones remain visually dominant
— weaker zones use a softer palette
— archived zones are historical context, not active memory objects
📊 Memory Map panel:
— Active Zones
— Strong Memory
— Average Memory Score
🔧 Display controls:
— Both / Bullish Only / Bearish Only
— minimum displayed Memory Score
— Compact / Full / Off badge mode
— Dark / Light theme
— optional archived badges
— optional advanced candidate diagnostics
🎨 VISUALS
Active maps use a constant forward display horizon. The default is 50 bars.
As each new bar forms, the right edge advances by one bar so the map keeps the same forward distance from the current bar.
This is a display convention only. It does not mean the script predicts that price will visit, respect or react from the zone during the next 50 bars.
⚙️ KEY SETTINGS
⚙️ Reaction structure:
— Pivot Left / Right: default 3 / 3
— Qualification Window: default 20 bars
— Minimum Reaction: default 2.00 ATR
— Zone Depth: default 0.30 ATR
🧹 Zone quality:
— Same-Side Merge Distance: default 0.50 ATR
— Minimum Same-Side Birth Spacing: default 8 bars
— Maximum Active Zones: default 12
🧠 Memory model:
— Time Decay Lookback: default 120 bars
— Touch Decay Weight: controls repeated-interaction decay
— Penetration Damage Weight: controls structural damage from penetration
— Reaction Evaluation Window: default 12 bars
— Reinforcement / weakening thresholds: define how completed retests modify evidence
♻️ Lifecycle:
— Structural Invalidation Buffer: default 0.10 ATR
— Minimum Age Before Depletion: default 30 bars
— archived zones can remain visible after retirement
🎨 Visual settings:
— Theme: Dark / Light
— Map Projection Bars: default 50
— Status Emoji: optional
— Badge Mode: Compact / Full / Off
🎚️ Production controls:
— Active Side Filter: Both / Bullish Only / Bearish Only
— Minimum Displayed Score: visual filter only; hidden zones continue to be tracked internally
🔔 ALERTS
The script provides confirmed-bar alert conditions for:
— Memory Zone Touch
— Strong Memory Zone Touch
— Memory Zone Reinforced
— Memory Zone Invalidated
— New Strong Memory Zone
— Any Price Reaction Memory Alert
The script also supports TradingView's "Any alert() function call" workflow for a combined dynamic event stream when enabled in settings.
Alerts describe changes in the reaction-memory model. They are not automated trade instructions.
⚠️ IMPORTANT NOTES
— ⏳ Pivot confirmation is delayed by design. A pivot is only known after the configured right-side bars have completed.
— 🕰️ Historical zone origin is not realtime availability. After qualification, a zone can be drawn from its original pivot location for historical context. That does not mean the zone was known on that pivot bar; the pivot first required confirmation and the reaction then had to qualify.
— 📐 Post-touch reaction excludes the touch bar. Standard OHLC data does not reveal whether the favorable extreme of that candle occurred before or after the zone interaction, so reaction measurement begins after the touch bar.
— 🧮 Memory Score is not probability. It does not represent expected return, win rate, signal accuracy or the probability that a zone will hold.
— 🧱 Structural invalidation uses confirmed closes. A wick can penetrate deeply and damage Zone Integrity without automatically invalidating the zone.
— ↔️ The forward map is not a forecast. Projection length controls visual display only.
— 🗃️ Archived zones are historical context. Once retired, they no longer participate as active memory objects.
— 🌐 Zone density will differ across markets and timeframes. The model uses local ATR normalization rather than being tuned to one specific instrument.
— ⚡ Fast markets, gaps, session transitions, low-liquidity conditions and large volatility changes can cause zones to qualify, weaken, deplete or invalidate quickly.
— 🛠️ Changing model settings changes the meaning and lifecycle of the zones. Tighter settings do not automatically make the output more reliable.
🛡️ DISCLAIMER
This script is provided for educational and analytical purposes. It does not provide financial advice or guarantee future market behavior.
Bullish/Bearish classifications, Memory Scores, reaction zones, lifecycle states, status markers and alerts describe the script's internal model only. They should be evaluated together with the user's own analysis, risk management and understanding of market conditions.

🎯 | Free & PRO+ trading tools 📈
tradewsamet.com
discord.com/invite/WeunuuvjBG
tradewsamet.com
discord.com/invite/WeunuuvjBG
Haftungsausschluss
Die Informationen und Veröffentlichungen sind nicht als Finanz-, Anlage-, Handels- oder andere Arten von Ratschlägen oder Empfehlungen gedacht, die von TradingView bereitgestellt oder gebilligt werden, und stellen diese nicht dar. Lesen Sie mehr in den Nutzungsbedingungen.
🎯 | Free & PRO+ trading tools 📈
tradewsamet.com
discord.com/invite/WeunuuvjBG
tradewsamet.com
discord.com/invite/WeunuuvjBG
Haftungsausschluss
Die Informationen und Veröffentlichungen sind nicht als Finanz-, Anlage-, Handels- oder andere Arten von Ratschlägen oder Empfehlungen gedacht, die von TradingView bereitgestellt oder gebilligt werden, und stellen diese nicht dar. Lesen Sie mehr in den Nutzungsbedingungen.