OPEN-SOURCE SCRIPT
Black Diamond - Pivot Points with alerts
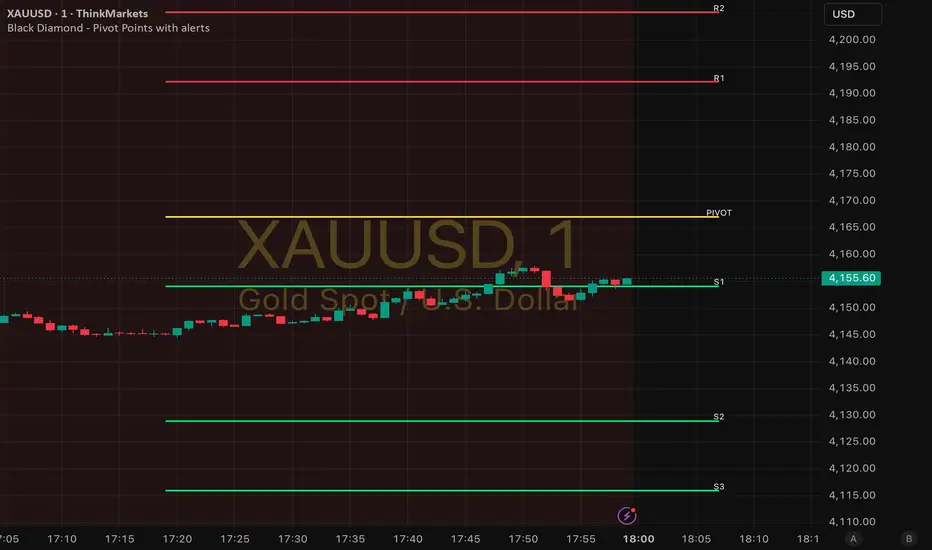
# Carl's Pivot Points - Left & Right Extension With Alerts V6
## OVERVIEW
Carl's Pivot Points V6 is a clean and professional pivot point indicator designed to help traders quickly identify key support and resistance levels based on previous market data.
The indicator automatically calculates and displays:
• Pivot Point (PP)
• Resistance 1 (R1)
• Resistance 2 (R2)
• Resistance 3 (R3)
• Support 1 (S1)
• Support 2 (S2)
• Support 3 (S3)
In addition to displaying the levels, the indicator provides customizable alerts and a visual market bias background based on price location relative to the Pivot Point.
The goal of this indicator is simplicity. Rather than filling your chart with unnecessary signals and complex calculations, Carl's Pivot Points focuses on providing traders with important institutional levels that can be used across all markets and timeframes.
---
## FEATURES
✓ Daily, Weekly or Monthly Pivot Source Selection
✓ Clean Support and Resistance Levels
✓ Adjustable Left and Right Line Extensions
✓ Individual Alert Options for Each Pivot Level
✓ Cross, Cross Up and Cross Down Alert Modes
✓ Visual Bullish and Bearish Background Bias
✓ Fully Customisable Colours
✓ Lightweight and Fast
✓ Suitable for Beginners and Experienced Traders
---
## HOW PIVOT POINTS WORK
Pivot Points are calculated using the previous period's:
• High
• Low
• Close
These values are used to create potential support and resistance levels for the current trading session.
Institutional traders, day traders and swing traders have used Pivot Points for decades as areas where price may:
• Reverse
• Stall
• Consolidate
• Break Out
Because many traders monitor these levels, they often become self-fulfilling areas of market interest.
---
## HOW TO USE THE INDICATOR
### Pivot Point (PP)
The Pivot Point is the most important level on the chart.
Price Above Pivot:
• Bullish Bias
• Buyers currently have control
• Look for buying opportunities
Price Below Pivot:
• Bearish Bias
• Sellers currently have control
• Look for selling opportunities
---
### Support Levels
S1:
First potential support level.
S2:
Stronger support level if S1 fails.
S3:
Extreme support level often associated with oversold conditions.
Possible Uses:
• Trade reversals
• Profit targets
• Stop loss placement
• Areas to watch for bullish reactions
---
### Resistance Levels
R1:
First potential resistance level.
R2:
Stronger resistance level if R1 breaks.
R3:
Extreme resistance level often associated with overbought conditions.
Possible Uses:
• Trade reversals
• Profit targets
• Stop loss placement
• Areas to watch for bearish reactions
---
## BACKGROUND BIAS
The optional background colouring provides an instant visual bias.
Green Background:
Price is trading above the Pivot Point.
Red Background:
Price is trading below the Pivot Point.
This feature helps traders quickly identify market direction without additional indicators.
---
## ALERT SYSTEM
The indicator includes fully customisable alerts.
You can choose alerts for:
• Pivot
• R1
• S1
• R2
• S2
• R3
• S3
Alert Modes:
Cross
Triggers when price crosses a level in either direction.
Cross Up
Triggers only when price moves upward through a level.
Cross Down
Triggers only when price moves downward through a level.
These alerts are ideal for traders who do not wish to constantly monitor charts.
---
## BEST WAYS TO USE THIS INDICATOR
### Trend Trading
Use the Pivot Point as your directional filter.
Above Pivot:
Focus on long opportunities.
Below Pivot:
Focus on short opportunities.
---
### Scalping
Watch for reactions around:
• Pivot
• S1
• R1
These levels often provide excellent short-term trading opportunities.
---
### Swing Trading
Use:
• S2
• S3
• R2
• R3
to identify larger reversal and profit-taking zones.
---
### Confluence Trading
For best results combine Pivot Levels with:
• Market Structure
• Support & Resistance
• Order Blocks
• Fair Value Gaps
• Liquidity Zones
• Trend Analysis
The strongest setups typically occur when multiple forms of analysis align at the same price level.
---
## SETTINGS GUIDE
Pivot Source Timeframe
Select Daily, Weekly or Monthly Pivot calculations.
Show Pivot
Show or hide the main Pivot Point.
Show R1/S1
Show or hide first support and resistance levels.
Show R2/S2
Show or hide second support and resistance levels.
Show R3/S3
Show or hide third support and resistance levels.
Line Width
Adjust line thickness.
Left Extension Bars
Controls how far levels extend to the left.
Right Extension Bars
Controls how far levels extend to the right.
Show Background Bias
Enable or disable bullish/bearish background colouring.
Alert Settings
Choose which levels trigger alerts.
Alert Trigger Type
Choose Cross, Cross Up or Cross Down.
---
## TRADING TIP
Do not treat Pivot Levels as automatic buy or sell signals.
Instead, think of them as areas of interest where price may react.
Always wait for confirmation from price action before entering a trade.
Patience and discipline will often outperform simply reacting to every level.
---
## DISCLAIMER
This indicator is provided for educational and informational purposes only.
Nothing contained within this indicator, its description, settings or alerts should be considered financial advice, investment advice or a recommendation to buy or sell any financial instrument.
Trading Forex, Commodities, Indices, Stocks and Cryptocurrencies carries a high level of risk and may not be suitable for all investors.
Past performance does not guarantee future results.
Users are solely responsible for their own trading decisions, risk management and financial outcomes.
Always conduct your own analysis and consult a qualified financial professional if required before making investment decisions.
Use this indicator entirely at your own risk.
## OVERVIEW
Carl's Pivot Points V6 is a clean and professional pivot point indicator designed to help traders quickly identify key support and resistance levels based on previous market data.
The indicator automatically calculates and displays:
• Pivot Point (PP)
• Resistance 1 (R1)
• Resistance 2 (R2)
• Resistance 3 (R3)
• Support 1 (S1)
• Support 2 (S2)
• Support 3 (S3)
In addition to displaying the levels, the indicator provides customizable alerts and a visual market bias background based on price location relative to the Pivot Point.
The goal of this indicator is simplicity. Rather than filling your chart with unnecessary signals and complex calculations, Carl's Pivot Points focuses on providing traders with important institutional levels that can be used across all markets and timeframes.
---
## FEATURES
✓ Daily, Weekly or Monthly Pivot Source Selection
✓ Clean Support and Resistance Levels
✓ Adjustable Left and Right Line Extensions
✓ Individual Alert Options for Each Pivot Level
✓ Cross, Cross Up and Cross Down Alert Modes
✓ Visual Bullish and Bearish Background Bias
✓ Fully Customisable Colours
✓ Lightweight and Fast
✓ Suitable for Beginners and Experienced Traders
---
## HOW PIVOT POINTS WORK
Pivot Points are calculated using the previous period's:
• High
• Low
• Close
These values are used to create potential support and resistance levels for the current trading session.
Institutional traders, day traders and swing traders have used Pivot Points for decades as areas where price may:
• Reverse
• Stall
• Consolidate
• Break Out
Because many traders monitor these levels, they often become self-fulfilling areas of market interest.
---
## HOW TO USE THE INDICATOR
### Pivot Point (PP)
The Pivot Point is the most important level on the chart.
Price Above Pivot:
• Bullish Bias
• Buyers currently have control
• Look for buying opportunities
Price Below Pivot:
• Bearish Bias
• Sellers currently have control
• Look for selling opportunities
---
### Support Levels
S1:
First potential support level.
S2:
Stronger support level if S1 fails.
S3:
Extreme support level often associated with oversold conditions.
Possible Uses:
• Trade reversals
• Profit targets
• Stop loss placement
• Areas to watch for bullish reactions
---
### Resistance Levels
R1:
First potential resistance level.
R2:
Stronger resistance level if R1 breaks.
R3:
Extreme resistance level often associated with overbought conditions.
Possible Uses:
• Trade reversals
• Profit targets
• Stop loss placement
• Areas to watch for bearish reactions
---
## BACKGROUND BIAS
The optional background colouring provides an instant visual bias.
Green Background:
Price is trading above the Pivot Point.
Red Background:
Price is trading below the Pivot Point.
This feature helps traders quickly identify market direction without additional indicators.
---
## ALERT SYSTEM
The indicator includes fully customisable alerts.
You can choose alerts for:
• Pivot
• R1
• S1
• R2
• S2
• R3
• S3
Alert Modes:
Cross
Triggers when price crosses a level in either direction.
Cross Up
Triggers only when price moves upward through a level.
Cross Down
Triggers only when price moves downward through a level.
These alerts are ideal for traders who do not wish to constantly monitor charts.
---
## BEST WAYS TO USE THIS INDICATOR
### Trend Trading
Use the Pivot Point as your directional filter.
Above Pivot:
Focus on long opportunities.
Below Pivot:
Focus on short opportunities.
---
### Scalping
Watch for reactions around:
• Pivot
• S1
• R1
These levels often provide excellent short-term trading opportunities.
---
### Swing Trading
Use:
• S2
• S3
• R2
• R3
to identify larger reversal and profit-taking zones.
---
### Confluence Trading
For best results combine Pivot Levels with:
• Market Structure
• Support & Resistance
• Order Blocks
• Fair Value Gaps
• Liquidity Zones
• Trend Analysis
The strongest setups typically occur when multiple forms of analysis align at the same price level.
---
## SETTINGS GUIDE
Pivot Source Timeframe
Select Daily, Weekly or Monthly Pivot calculations.
Show Pivot
Show or hide the main Pivot Point.
Show R1/S1
Show or hide first support and resistance levels.
Show R2/S2
Show or hide second support and resistance levels.
Show R3/S3
Show or hide third support and resistance levels.
Line Width
Adjust line thickness.
Left Extension Bars
Controls how far levels extend to the left.
Right Extension Bars
Controls how far levels extend to the right.
Show Background Bias
Enable or disable bullish/bearish background colouring.
Alert Settings
Choose which levels trigger alerts.
Alert Trigger Type
Choose Cross, Cross Up or Cross Down.
---
## TRADING TIP
Do not treat Pivot Levels as automatic buy or sell signals.
Instead, think of them as areas of interest where price may react.
Always wait for confirmation from price action before entering a trade.
Patience and discipline will often outperform simply reacting to every level.
---
## DISCLAIMER
This indicator is provided for educational and informational purposes only.
Nothing contained within this indicator, its description, settings or alerts should be considered financial advice, investment advice or a recommendation to buy or sell any financial instrument.
Trading Forex, Commodities, Indices, Stocks and Cryptocurrencies carries a high level of risk and may not be suitable for all investors.
Past performance does not guarantee future results.
Users are solely responsible for their own trading decisions, risk management and financial outcomes.
Always conduct your own analysis and consult a qualified financial professional if required before making investment decisions.
Use this indicator entirely at your own risk.
Open-source Skript
Ganz im Sinne von TradingView hat dieser Autor sein/ihr Script als Open-Source veröffentlicht. Auf diese Weise können nun auch andere Trader das Script rezensieren und die Funktionalität überprüfen. Vielen Dank an den Autor! Sie können das Script kostenlos verwenden, aber eine Wiederveröffentlichung des Codes unterliegt unseren Hausregeln.

Haftungsausschluss
Die Informationen und Veröffentlichungen sind nicht als Finanz-, Anlage-, Handels- oder andere Arten von Ratschlägen oder Empfehlungen gedacht, die von TradingView bereitgestellt oder gebilligt werden, und stellen diese nicht dar. Lesen Sie mehr in den Nutzungsbedingungen.
Open-source Skript
Ganz im Sinne von TradingView hat dieser Autor sein/ihr Script als Open-Source veröffentlicht. Auf diese Weise können nun auch andere Trader das Script rezensieren und die Funktionalität überprüfen. Vielen Dank an den Autor! Sie können das Script kostenlos verwenden, aber eine Wiederveröffentlichung des Codes unterliegt unseren Hausregeln.
Haftungsausschluss
Die Informationen und Veröffentlichungen sind nicht als Finanz-, Anlage-, Handels- oder andere Arten von Ratschlägen oder Empfehlungen gedacht, die von TradingView bereitgestellt oder gebilligt werden, und stellen diese nicht dar. Lesen Sie mehr in den Nutzungsbedingungen.