OPEN-SOURCE SCRIPT
Uptrick: ML Kernel Regression
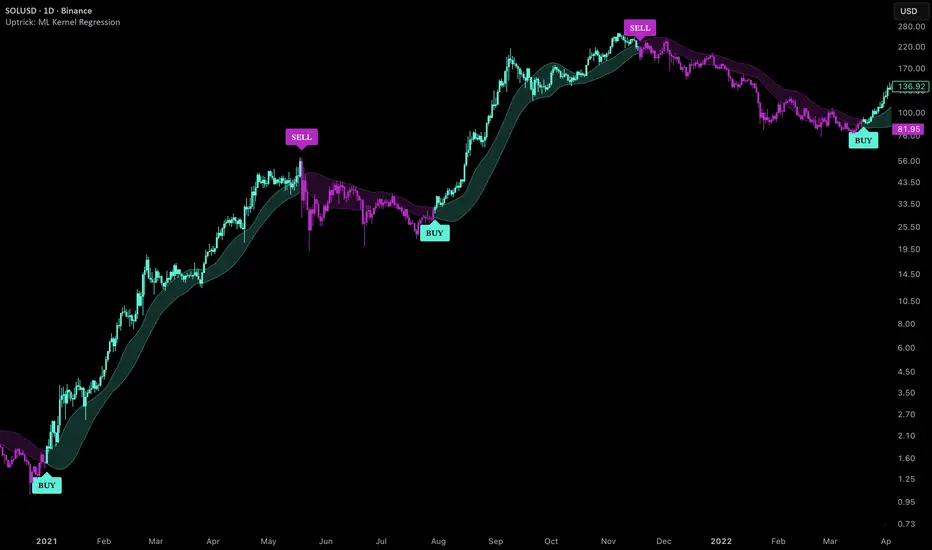
Introduction
This indicator applies Nadaraya-Watson kernel regression, a non-parametric machine learning estimator, directly to price data in order to produce a smooth, noise-reduced representation of the market's underlying trend. Unlike moving averages that apply equal or linearly decaying weights, this method uses a Gaussian kernel function to assign weights based on how far back in time each bar sits relative to the current one. Bars closer in time receive exponentially higher weights, while older bars decay naturally. The result is a regression curve that adapts organically to local price structure rather than imposing a fixed lag model onto the data. Residual bands are then constructed around this curve using the rolling standard deviation of the difference between price and the regression line, forming dynamic envelopes that reflect actual price dispersion rather than arbitrary multipliers of a fixed moving average.
The indicator is designed for traders who want a statistically grounded trend baseline with state-driven directional signals, without relying on lagging traditional averages. It is built in Pine Script v6 and is fully non-repainting. All state decisions are committed only on confirmed bars, meaning no signal is generated intra-bar and no future bar data influences the output.
How It Works
The core calculation is the Nadaraya-Watson estimator. At each bar the indicator looks back across a user-defined window and computes a weighted average of past closing prices. The weight assigned to each historical bar is determined by the Gaussian kernel: weight = exp( -lag² / (2 · h²) ), where lag is the number of bars back and h is the bandwidth parameter. A larger bandwidth makes the curve smoother and slower to react. A smaller bandwidth makes it more reactive but noisier.
When adaptive bandwidth is enabled, the bandwidth h is scaled dynamically by a normalised ATR factor. In volatile periods, the kernel widens, producing a smoother estimate that avoids overreacting to spike conditions. In calm periods, the kernel tightens, allowing the curve to track price more closely. This makes the regression inherently context-aware without requiring the user to manually switch settings across different market regimes.
The residual at each bar is defined as the difference between the closing price and the regression value. A rolling standard deviation of these residuals forms the sigma value, which is then smoothed via EMA. The upper and lower bands are placed at a user-controlled multiple of sigma above and below the kernel line. Because the bands are derived from actual price-to-regression deviation, they expand during high-dispersion conditions and contract when price tracks the regression tightly.
State is classified as bullish when price closes above the upper band on a confirmed bar, and bearish when price closes below the lower band on a confirmed bar. Between breakout events the state persists, meaning the indicator holds its last valid directional reading rather than flipping to neutral. This gives the signal a regime-like quality rather than a purely oscillatory one.
Features
- Nadaraya-Watson Gaussian kernel regression curve computed from scratch over a fully user-controlled lookback window
- Adaptive bandwidth scaling driven by a normalised ATR factor, widening the kernel during volatile conditions and tightening it during calm ones
- Residual-based standard deviation bands that expand and contract with actual price-to-regression dispersion rather than fixed multipliers
- Smoothing controls for both the main regression output and the band width, allowing fine-tuning of reactivity versus stability
- Three visual display modes: Bands mode showing the full envelope, Single Line mode showing only the regression curve with a gradient fill toward price, and Trail mode showing only the relevant band side as a directional trail
- Gradient fills in all three visual modes that fade from the regression line outward toward price, maintaining visual clarity without obscuring price action
- State-based bar coloring that applies the directional regime color to every candle, using custom plotcandle rendering for full wickcolor and bordercolor consistency
- Signal labels that appear only on confirmed state transitions, placed at user-selectable anchors including High or Low, the Main Line, or the Band levels, with adjustable ATR-based offset
- Seven selectable color themes covering Classic, Cyber Aqua, Crimson Pulse, Royal Purple, Emerald Night, Minimal Mono, and Classic Emerald, each providing a complete set of bull, bear, neutral, background, and frame colors
- A live dashboard table displaying current signal direction, kernel MA value, upper band value, lower band value, current sigma width, and active bandwidth including whether adaptive mode is engaged
- Alert conditions for bullish breakout above the upper band and bearish breakdown below the lower band, both tied to confirmed crossover and crossunder events
- Toggle controls for bar coloring, band fill, and the dashboard table independently
Dashboard:
Band Mode:
Single Line Mode:
Trail Mode:
Inputs
- Lookback Window: controls how many historical bars the Gaussian kernel sums over. Larger values produce a slower, broader regression curve. Default is 30.
- Base Bandwidth (h): sets the core width of the Gaussian kernel. Higher values create smoother, more generalized curves. Lower values track price more closely. Default is 8.0.
- Adaptive Bandwidth: when enabled, the bandwidth is multiplied by a factor derived from normalised ATR, making the kernel wider in volatile conditions. Default is enabled.
- ATR Length (adaptive): the period used to compute the ATR for adaptive scaling. Default is 14.
- MA Output Smoothing: applies an EMA pass over the raw regression output to reduce micro-jitter in the curve. Default is 3.
- Band Multiplier (sigma): how many standard deviations above and below the regression line the bands are placed. Default is 1.0.
- Band Lookback (sigma): the rolling window used to compute the standard deviation of residuals. Default is 24.
- Band Smoothing: EMA smoothing applied to the raw sigma value to stabilize band movement. Default is 5.
- Visual Mode: selects between Bands, Single Line, and Trail display modes.
- Color Bars: enables state-colored candles. Default is enabled.
- Fill Bands: enables the semi-transparent fill between upper and lower bands. Default is enabled.
- Show Dashboard: toggles the live data table. Default is enabled.
- Color Gradient Smooth: controls color smoothing, currently reserved for future gradient transitions.
- Label Anchor: selects where signal labels are pinned. Options are High or Low, Main Line, and Bands.
- Offset Mult (ATR): scales how far above or below the anchor point labels are offset. Default is 0.50.
- Theme: selects the color theme across all visual elements.
- Alert: Cross Above Upper Band: enables the bullish breakout alert condition.
- Alert: Cross Below Lower Band: enables the bearish breakdown alert condition.
Originality
The originality of this script lies in the combination of a properly implemented Nadaraya-Watson estimator with an ATR-adaptive bandwidth system, residual standard deviation bands, and a persistent non-neutral state engine, all packaged with a multi-mode visual system that adjusts its presentation to the current directional regime. The regression curve is not a modified moving average. It is a genuine weighted least squares estimate computed bar by bar using a Gaussian kernel function. The adaptive bandwidth mechanism means the indicator does not treat all market conditions equally, which is a meaningful departure from static-parameter band systems. The state logic prioritises confirmed readings and persists between band contacts, which makes the regime classification stable and avoids the false-neutral problem common in threshold-based indicators. The three visual modes serve distinct use cases: Bands for envelope and breakout context, Single Line for a clean trend baseline, and Trail for a dynamic support or resistance reference that follows the active regime. These elements are not assembled from existing published open-source scripts; the full codebase is original work by the author.
Conclusion
Uptrick: ML Kernel Regression provides a statistically grounded approach to price smoothing and trend regime classification by applying a Gaussian kernel estimator rather than a conventional moving average. The adaptive bandwidth, residual bands, and persistent state logic work together to give traders a tool that reflects actual market behaviour rather than imposing fixed parameters onto it. The multiple visual modes and theme system make it practical across a range of chart styles and use cases.
Disclaimer
This script is published for educational and analytical purposes only. Nothing in this script or its description constitutes financial advice, investment advice, or a recommendation to buy or sell any asset. All trading involves risk. Past performance of any indicator or signal does not guarantee future results. You are solely responsible for your own trading decisions.
Open-source Skript
Ganz im Sinne von TradingView hat dieser Autor sein/ihr Script als Open-Source veröffentlicht. Auf diese Weise können nun auch andere Trader das Script rezensieren und die Funktionalität überprüfen. Vielen Dank an den Autor! Sie können das Script kostenlos verwenden, aber eine Wiederveröffentlichung des Codes unterliegt unseren Hausregeln.

💎 Free Discord: discord.gg/Def47ueyuD
💎 Website: uptrick.io
Nothing is financial advice. Always do your own research.
💎 Website: uptrick.io
Nothing is financial advice. Always do your own research.
Haftungsausschluss
Die Informationen und Veröffentlichungen sind nicht als Finanz-, Anlage-, Handels- oder andere Arten von Ratschlägen oder Empfehlungen gedacht, die von TradingView bereitgestellt oder gebilligt werden, und stellen diese nicht dar. Lesen Sie mehr in den Nutzungsbedingungen.
Open-source Skript
Ganz im Sinne von TradingView hat dieser Autor sein/ihr Script als Open-Source veröffentlicht. Auf diese Weise können nun auch andere Trader das Script rezensieren und die Funktionalität überprüfen. Vielen Dank an den Autor! Sie können das Script kostenlos verwenden, aber eine Wiederveröffentlichung des Codes unterliegt unseren Hausregeln.
💎 Free Discord: discord.gg/Def47ueyuD
💎 Website: uptrick.io
Nothing is financial advice. Always do your own research.
💎 Website: uptrick.io
Nothing is financial advice. Always do your own research.
Haftungsausschluss
Die Informationen und Veröffentlichungen sind nicht als Finanz-, Anlage-, Handels- oder andere Arten von Ratschlägen oder Empfehlungen gedacht, die von TradingView bereitgestellt oder gebilligt werden, und stellen diese nicht dar. Lesen Sie mehr in den Nutzungsbedingungen.