ATK/DEF Quant Mecha WarShield Command
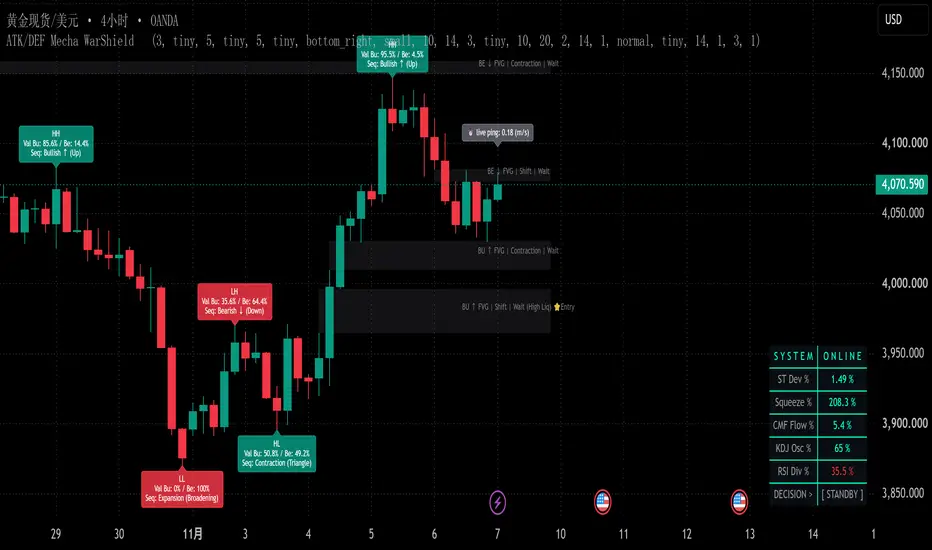
# ATK/DEF Quant Mecha WarShield Command
### Quantitative Market Analysis & Entry Signal Decision System
ATK/DEF Quant Mecha WarShield is a quantitative market analysis and entry signal system designed to observe market structure, volatility, momentum, capital flow, and price behavior through multiple calculation modules.
The system combines statistical measurements with structured market conditions to provide a visual overview of market activity and potential entry opportunities.
### Core Modules
**1. Quantitative Command Dashboard**
- Supertrend Direction
- Volatility & Squeeze Measurement
- Chaikin Money Flow (CMF)
- KDJ Momentum Oscillation
- RSI Pivot Analysis
- Market Condition Classification
**2. Market Structure Intelligence**
- Higher High (HH)
- Higher Low (HL)
- Lower High (LH)
- Lower Low (LL)
- Bullish / Bearish Structure
- Expansion / Contraction / Complex Conditions
**3. Fair Value Gap (FVG) Analysis**
- Bullish and Bearish FVG Detection
- Explosive / Contraction / Shift Classification
- Accumulation / Distribution / Wait Conditions
- Entry Signal Identification
- FVG Mitigation Monitoring
**4. Order Block (OB) Analysis**
- Bullish and Bearish Order Block Detection
- Zone Monitoring
- Recovery / Consumption Conditions
- Entry Signal Identification
- Order Block Mitigation Monitoring
**5. ATR Volatility & Defense System**
- ATR-Based Upper and Lower Boundaries
- Dynamic Defense Zones
- Volatility Distance Measurement
- Market Boundary Monitoring
**6. Live Momentum & Pressure Monitoring**
- Momentum Measurement
- Volatility Compression
- Pressure Calculation
- Explosive Movement Detection
**7. Market Breakout Monitoring**
- Breakout Above LH
- Breakout Below HL
- Bullish Attack / Bearish Attack Conditions
### Entry Signal Concept
The system uses `ENTRY` as a unified signal label.
Entry signals are generated from programmed calculation conditions within the relevant modules.
Users should independently observe and evaluate market conditions before making any decisions.
### Chart Examples
The following charts illustrate different market conditions and indicator behavior:
1.
2.
3.
4.
5.
6.
Signal Usage & Decision Disclaimer
This technical indicator utilizes statistical calculations to generate market observations and entry signals through a quantitative monitoring and decision-support system.
All signals are derived from programmed conditions and should be independently evaluated in the context of prevailing market conditions.
responsible for observing, assessing, and making their own market decisions. Signals should not be treated as definitive instructions or independent confirmation of market direction.
This indicator is not intended for standalone use. Combining it with other technical indicators, market structure analysis, and relevant market data is strongly recommended for additional confirmation before making any market decisions.
### Quantitative Market Analysis & Entry Signal Decision System
ATK/DEF Quant Mecha WarShield is a quantitative market analysis and entry signal system designed to observe market structure, volatility, momentum, capital flow, and price behavior through multiple calculation modules.
The system combines statistical measurements with structured market conditions to provide a visual overview of market activity and potential entry opportunities.
### Core Modules
**1. Quantitative Command Dashboard**
- Supertrend Direction
- Volatility & Squeeze Measurement
- Chaikin Money Flow (CMF)
- KDJ Momentum Oscillation
- RSI Pivot Analysis
- Market Condition Classification
**2. Market Structure Intelligence**
- Higher High (HH)
- Higher Low (HL)
- Lower High (LH)
- Lower Low (LL)
- Bullish / Bearish Structure
- Expansion / Contraction / Complex Conditions
**3. Fair Value Gap (FVG) Analysis**
- Bullish and Bearish FVG Detection
- Explosive / Contraction / Shift Classification
- Accumulation / Distribution / Wait Conditions
- Entry Signal Identification
- FVG Mitigation Monitoring
**4. Order Block (OB) Analysis**
- Bullish and Bearish Order Block Detection
- Zone Monitoring
- Recovery / Consumption Conditions
- Entry Signal Identification
- Order Block Mitigation Monitoring
**5. ATR Volatility & Defense System**
- ATR-Based Upper and Lower Boundaries
- Dynamic Defense Zones
- Volatility Distance Measurement
- Market Boundary Monitoring
**6. Live Momentum & Pressure Monitoring**
- Momentum Measurement
- Volatility Compression
- Pressure Calculation
- Explosive Movement Detection
**7. Market Breakout Monitoring**
- Breakout Above LH
- Breakout Below HL
- Bullish Attack / Bearish Attack Conditions
### Entry Signal Concept
The system uses `ENTRY` as a unified signal label.
Entry signals are generated from programmed calculation conditions within the relevant modules.
Users should independently observe and evaluate market conditions before making any decisions.
### Chart Examples
The following charts illustrate different market conditions and indicator behavior:
1.
2.
3.
4.
5.
6.
Signal Usage & Decision Disclaimer
This technical indicator utilizes statistical calculations to generate market observations and entry signals through a quantitative monitoring and decision-support system.
All signals are derived from programmed conditions and should be independently evaluated in the context of prevailing market conditions.
responsible for observing, assessing, and making their own market decisions. Signals should not be treated as definitive instructions or independent confirmation of market direction.
This indicator is not intended for standalone use. Combining it with other technical indicators, market structure analysis, and relevant market data is strongly recommended for additional confirmation before making any market decisions.

Haftungsausschluss
Die Informationen und Veröffentlichungen sind nicht als Finanz-, Anlage-, Handels- oder andere Arten von Ratschlägen oder Empfehlungen gedacht, die von TradingView bereitgestellt oder gebilligt werden, und stellen diese nicht dar. Lesen Sie mehr in den Nutzungsbedingungen.
Haftungsausschluss
Die Informationen und Veröffentlichungen sind nicht als Finanz-, Anlage-, Handels- oder andere Arten von Ratschlägen oder Empfehlungen gedacht, die von TradingView bereitgestellt oder gebilligt werden, und stellen diese nicht dar. Lesen Sie mehr in den Nutzungsbedingungen.