PROTECTED SOURCE SCRIPT
Aktualisiert NY Opening 3H Strategy
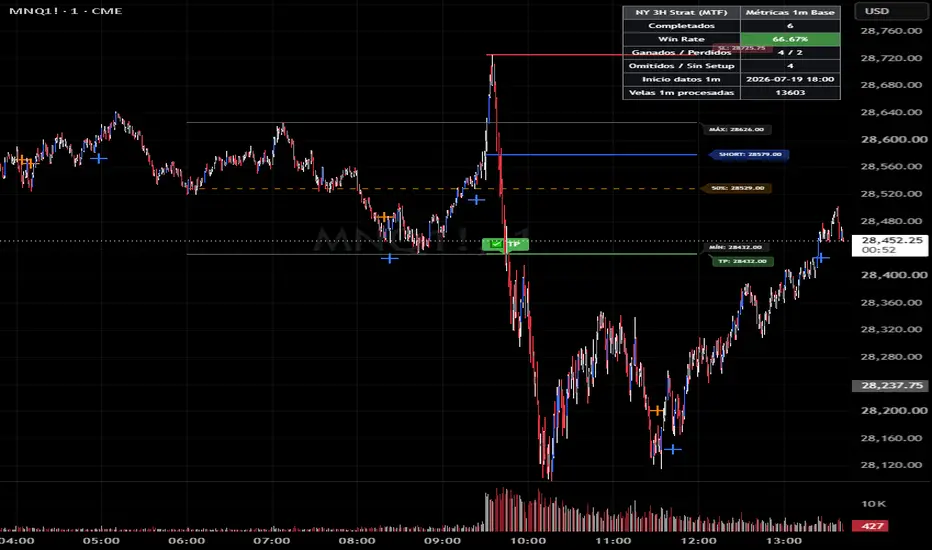
# 🗽 NY Opening 3H Strategy
The **NY Opening 3H Strategy** indicator is designed to trade the New York session open automatically and precisely using a strategy based on institutional reference ranges and 1-minute price breakouts.
---
## 🕒 How It Works by Time Blocks
The indicator automatically divides the daily trading session into three key blocks (configured in the New York time zone `America/New_York`):
1. **Reference Session (06:00 - 09:00 NY):**
* The indicator calculates the initial range by plotting the **High**, **Low**, and **50% level (Midpoint)** of this period. These lines are displayed in gray and orange.
2. **Manipulation Window (09:00 - 10:00 NY):**
* During the first third of the open, price attempts to break out of the reference range limits (up or down). The first breakout defines the bias direction (**LONG** or **SHORT**) and records the extreme reached.
3. **Full Operating Session (09:00 - 12:00 NY):**
* Dynamic execution lines are deployed. If price retraces and triggers the entry level, the trade is managed automatically, evaluating whether it hits the **Take Profit (TP)** or **Stop Loss (SL)**.
---
## ⚙️ Configuration and Parameters
You can customize all aspects of the indicator from the settings menu in TradingView:
* **Session Configuration:**
* *Reference Session:* `06:00-09:00`
* *Manipulation Window:* `09:00-10:00`
* *Operating Session:* `09:00-12:00`
* *Time Zone:* `America/New_York`
* **Risk Management:**
* *Risk / Reward Ratio (R/R):* Adjustable (defaulting to `1.0`) to multiply the Take Profit distance relative to the risk assumed.
* **Aesthetics and Colors:** Customize the thickness and color of the reference lines, midpoint, entry, stop loss, and take profit according to your visual preferences.
---
## 📊 Signal Reading and Live Panel
* **Dynamic Chart Lines:**
* 🔵 **Entry Line (Blue)** with exact price label.
* 🔴 **Stop Loss (Red)** located at the manipulation extreme.
* 🟢 **Take Profit (Green)** projected according to the configured R/R.
* **Result Markers:** Visual alerts will appear on the chart with icons for `✅ TP` when a trade is successful, `❌ SL` if the stop is hit, or `⚪ No Setup` if the session passes without valid opportunities.
* **Metrics Panel (Top Right Corner):** Displays real-time data on total completed trades, the **Win Rate** percentage with dynamic color changes, win/loss breakdown, and candle processing statistics.
---
💡 **Pro Tip:** It is recommended to use this indicator on **1-minute (1m)** or lower timeframes, as the internal engine processes data on the 1m chart to guarantee maximum precision in triggering entries and stops.
The **NY Opening 3H Strategy** indicator is designed to trade the New York session open automatically and precisely using a strategy based on institutional reference ranges and 1-minute price breakouts.
---
## 🕒 How It Works by Time Blocks
The indicator automatically divides the daily trading session into three key blocks (configured in the New York time zone `America/New_York`):
1. **Reference Session (06:00 - 09:00 NY):**
* The indicator calculates the initial range by plotting the **High**, **Low**, and **50% level (Midpoint)** of this period. These lines are displayed in gray and orange.
2. **Manipulation Window (09:00 - 10:00 NY):**
* During the first third of the open, price attempts to break out of the reference range limits (up or down). The first breakout defines the bias direction (**LONG** or **SHORT**) and records the extreme reached.
3. **Full Operating Session (09:00 - 12:00 NY):**
* Dynamic execution lines are deployed. If price retraces and triggers the entry level, the trade is managed automatically, evaluating whether it hits the **Take Profit (TP)** or **Stop Loss (SL)**.
---
## ⚙️ Configuration and Parameters
You can customize all aspects of the indicator from the settings menu in TradingView:
* **Session Configuration:**
* *Reference Session:* `06:00-09:00`
* *Manipulation Window:* `09:00-10:00`
* *Operating Session:* `09:00-12:00`
* *Time Zone:* `America/New_York`
* **Risk Management:**
* *Risk / Reward Ratio (R/R):* Adjustable (defaulting to `1.0`) to multiply the Take Profit distance relative to the risk assumed.
* **Aesthetics and Colors:** Customize the thickness and color of the reference lines, midpoint, entry, stop loss, and take profit according to your visual preferences.
---
## 📊 Signal Reading and Live Panel
* **Dynamic Chart Lines:**
* 🔵 **Entry Line (Blue)** with exact price label.
* 🔴 **Stop Loss (Red)** located at the manipulation extreme.
* 🟢 **Take Profit (Green)** projected according to the configured R/R.
* **Result Markers:** Visual alerts will appear on the chart with icons for `✅ TP` when a trade is successful, `❌ SL` if the stop is hit, or `⚪ No Setup` if the session passes without valid opportunities.
* **Metrics Panel (Top Right Corner):** Displays real-time data on total completed trades, the **Win Rate** percentage with dynamic color changes, win/loss breakdown, and candle processing statistics.
---
💡 **Pro Tip:** It is recommended to use this indicator on **1-minute (1m)** or lower timeframes, as the internal engine processes data on the 1m chart to guarantee maximum precision in triggering entries and stops.
Versionshinweise
Screenshot and version Updated.Versionshinweise
Chart UpdatedGeschütztes Skript
Dieses Script ist als Closed-Source veröffentlicht. Sie können es kostenlos und ohne Einschränkungen verwenden – erfahren Sie hier mehr.

Haftungsausschluss
Die Informationen und Veröffentlichungen sind nicht als Finanz-, Anlage-, Handels- oder andere Arten von Ratschlägen oder Empfehlungen gedacht, die von TradingView bereitgestellt oder gebilligt werden, und stellen diese nicht dar. Lesen Sie mehr in den Nutzungsbedingungen.
Geschütztes Skript
Dieses Script ist als Closed-Source veröffentlicht. Sie können es kostenlos und ohne Einschränkungen verwenden – erfahren Sie hier mehr.
Haftungsausschluss
Die Informationen und Veröffentlichungen sind nicht als Finanz-, Anlage-, Handels- oder andere Arten von Ratschlägen oder Empfehlungen gedacht, die von TradingView bereitgestellt oder gebilligt werden, und stellen diese nicht dar. Lesen Sie mehr in den Nutzungsbedingungen.