OPEN-SOURCE SCRIPT
Shaakuni HTF Candle Projection & Structure Bias
Overview
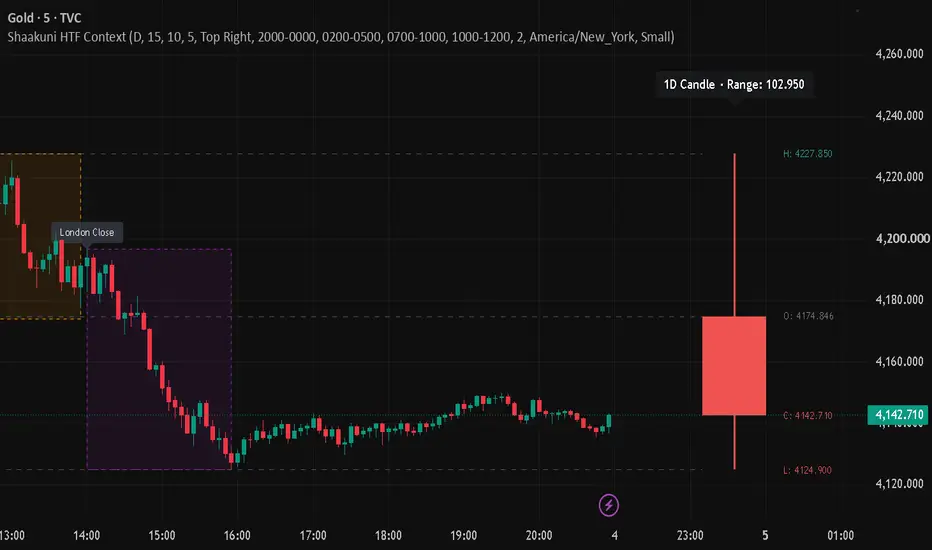
Shaakuni HTF Candle Projection & Structure Bias lets you keep an eye on a higher-timeframe (HTF) candle while you work on a lower-timeframe chart. It builds the currently forming HTF candle from your chart's own bars and shows a copy of it to the right of price, so you can see its open, high, low, close and range at a glance. It also draws session high/low boxes (Asian, London, New York, London Close) and can show an optional table with a simple structure reading for 1H, 4H and 1D. It does not give buy or sell signals, it does not forecast where the HTF candle will close, and it does not detect Power of 3 phases.
Why these parts are in one script
A higher-timeframe candle shows where the larger-scale open, high and low are. Session boxes show how smaller intraday ranges formed inside that candle. The optional structure table adds a quick top-down reading of 1H, 4H and 1D. Together they give a top-down view on one chart without switching timeframes. Each part can be switched off in the settings.
Key concept
Power of 3 (PO3) is a framework in which a candle is read as three stages: accumulation, manipulation and distribution. A common way to study it is to watch a higher-timeframe candle's open and see how price moves relative to it during the trading sessions. This script does not label those stages. It supplies the pieces (the live HTF candle with its open, and the session ranges) so you can observe them yourself.
How the projected candle works
On every bar the script checks whether a new HTF candle has started, using the symbol's own HTF time boundaries. When one starts, it stores that bar's open, and then updates the high and low with every chart bar; the close is the latest price. On the last bar the script draws a candle to the right of price, shifted by "Right Offset" bars, with a body width set by "Projected Candle Width". Dashed lines connect the HTF open, high and low from the bar where the candle began to the projected candle, and labels show O, H, L, C and the range. The candle is green when close is at or above open and red otherwise. This is a live copy of the current HTF candle and not a prediction. It is drawn in the empty area to the right only to keep it out of the way of price.
Structure table
The table is optional and off by default ("Show Context Table"). For each of 1H, 4H and 1D, the script finds confirmed pivot highs and pivot lows using "Swing Pivot Length" (default 5 bars on each side) and compares the last two highs and the last two lows. If both are rising it shows BULLISH, if both are falling it shows BEARISH, and otherwise NEUTRAL. A pivot is only confirmed after that many bars have passed, so this reading lags by design. The data is requested without look-ahead. It is a simple higher-high / lower-low reading, not a full break-of-structure model. The table also shows the session that is currently active.
Session boxes
For each enabled session the script draws a box from the start of the session, expanding to the highest high and lowest low reached, with a label. Boxes are kept for the last N days ("Show Sessions For"). Default times are in New York time: Asian 20:00-00:00, London 02:00-05:00, New York 07:00-10:00, London Close 10:00-12:00. Times, colours and the timezone can be changed. Session boxes need an intraday chart.
How to use it
For example, on a 5 or 15 minute chart with the Daily as the higher timeframe, the projected candle shows where the daily open is relative to current price and how large the day's range is so far. The session boxes show whether, for example, London or New York traded above or below the Asian range. Many traders use references like these as context for their own analysis; the script does not tell you when to enter or exit.
Why it is built this way
HTF candle displays and session boxes are common ideas and this script does not claim to have invented them. What it combines is a live HTF candle with an adjustable offset and mapping lines back to its open, editable session ranges, and an optional pivot-based structure reading for three timeframes, in one script with open source code that you can read and change.
Limitations
The HTF must be higher than the chart timeframe; otherwise nothing is projected and the table shows a message. HTF candle boundaries follow the symbol's own session, so the daily open can differ from other data providers. If the chart has little history loaded, the first HTF candle can be partial. The 1H, 4H and 1D readings can change until those bars close, and pivots confirm late by design. Session boxes need an intraday chart. This is a visual aid and not financial advice.
Open-source Skript
Ganz im Sinne von TradingView hat dieser Autor sein/ihr Script als Open-Source veröffentlicht. Auf diese Weise können nun auch andere Trader das Script rezensieren und die Funktionalität überprüfen. Vielen Dank an den Autor! Sie können das Script kostenlos verwenden, aber eine Wiederveröffentlichung des Codes unterliegt unseren Hausregeln.

Haftungsausschluss
Die Informationen und Veröffentlichungen sind nicht als Finanz-, Anlage-, Handels- oder andere Arten von Ratschlägen oder Empfehlungen gedacht, die von TradingView bereitgestellt oder gebilligt werden, und stellen diese nicht dar. Lesen Sie mehr in den Nutzungsbedingungen.
Open-source Skript
Ganz im Sinne von TradingView hat dieser Autor sein/ihr Script als Open-Source veröffentlicht. Auf diese Weise können nun auch andere Trader das Script rezensieren und die Funktionalität überprüfen. Vielen Dank an den Autor! Sie können das Script kostenlos verwenden, aber eine Wiederveröffentlichung des Codes unterliegt unseren Hausregeln.
Haftungsausschluss
Die Informationen und Veröffentlichungen sind nicht als Finanz-, Anlage-, Handels- oder andere Arten von Ratschlägen oder Empfehlungen gedacht, die von TradingView bereitgestellt oder gebilligt werden, und stellen diese nicht dar. Lesen Sie mehr in den Nutzungsbedingungen.