OPEN-SOURCE SCRIPT
CTZ MVRV Z-Score & Realized Cap
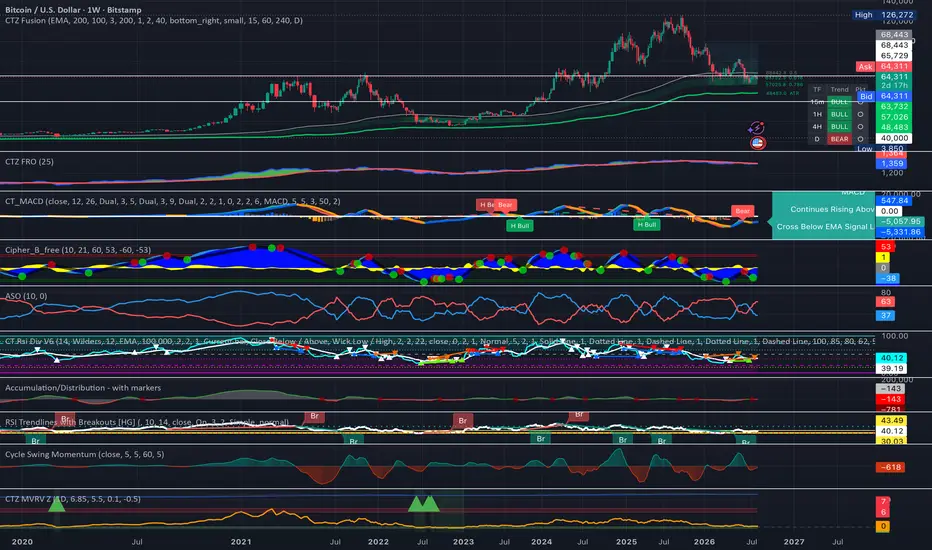
Here's a TradingView description for it. I've kept the emphasis where you asked — it's a stronger bottom-picker than top-picker — and stayed honest about what it is and its limits.
---
**CTZ MVRV Z-Score & Realized Cap**
An on-chain valuation tool for Bitcoin that compares what the market is paying for BTC against what holders actually paid for it — and flags when price has fallen below the aggregate cost basis, which is historically where major bottoms form.
This pulls real on-chain data (CoinMetrics Market Cap and Realized Cap via TradingView), not a price-based approximation. Run it on a BTCUSD chart for full history.
WHAT IT MEASURES
Market Cap is Bitcoin's price times circulating supply — what the network is worth right now. Realized Cap values every coin at the price it last moved on-chain, so it represents the aggregate cost basis of all holders — what the market actually paid.
From these two it builds:
MVRV Ratio — Market Cap divided by Realized Cap. Above 1, holders are in aggregate profit; below 1, the market is in aggregate loss, which is rare and historically a strong accumulation signal.
MVRV Z-Score — the orange line. It standardises the gap between market value and realized value against its own historical deviation, so extremes stand out clearly across cycles. A green accumulation band sits at the bottom, a red distribution band up top.
Below-Realized flag — when Market Cap drops below Realized Cap (price below the average cost basis of the whole market), the background shades green. This is the core bottom condition and the reason the tool leans the way it does.
BETTER FOR BOTTOMS THAN TOPS — READ THIS
Be clear on how to use this: it is a far more reliable bottom-picker than top-picker.
The bottom signal is grounded in something real and hard to fake — when price falls below the market's aggregate cost basis, the average holder is underwater, and that level of capitulation has marked every major Bitcoin bottom to date. It's a rare, high-conviction condition. When the Z-Score sinks into the green zone or the background flags below-realized, history says you are near a generational buying area.
The top signal is looser. Cycle tops have printed at very different Z-Score peaks as the asset has matured — each cycle tends to top at a lower Z-Score than the last as Bitcoin grows and volatility compresses. So the red band is a "getting expensive, take note" warning, not a precise sell trigger. Treat a green-zone reading as a strong signal to accumulate; treat a red-zone reading as a caution flag to pair with your own confirmation, never as a standalone exit.
In short: lean on it hard at the bottoms, lean on it lightly at the tops.
HOW TO USE IT
Run it on BTCUSD (or INDEX:BTCUSD / BLX for the longest history). Watch for the orange Z-Score entering the green band or the green background appearing — those are your accumulation windows. Use the red band as an overvaluation caution rather than a timed top. You can toggle between the Z-Score and the raw MVRV ratio, and adjust the zone thresholds to your own cycle read.
NOTES
This relies on TradingView's on-chain data feed. If the on-chain series don't resolve on your plan, the tool shows a notice instead of plotting approximate data — it will never fake the metric. Because Realized Cap is Bitcoin-specific, this is a BTC-only tool.
Valuation extremes tell you when, roughly, not exactly. Bottoms are a zone, not a single day, and tops even more so. Use this as a cycle-position framework alongside your own analysis, not as a standalone buy/sell signal.
For educational and analytical purposes only. Not financial advice.
---
**CTZ MVRV Z-Score & Realized Cap**
An on-chain valuation tool for Bitcoin that compares what the market is paying for BTC against what holders actually paid for it — and flags when price has fallen below the aggregate cost basis, which is historically where major bottoms form.
This pulls real on-chain data (CoinMetrics Market Cap and Realized Cap via TradingView), not a price-based approximation. Run it on a BTCUSD chart for full history.
WHAT IT MEASURES
Market Cap is Bitcoin's price times circulating supply — what the network is worth right now. Realized Cap values every coin at the price it last moved on-chain, so it represents the aggregate cost basis of all holders — what the market actually paid.
From these two it builds:
MVRV Ratio — Market Cap divided by Realized Cap. Above 1, holders are in aggregate profit; below 1, the market is in aggregate loss, which is rare and historically a strong accumulation signal.
MVRV Z-Score — the orange line. It standardises the gap between market value and realized value against its own historical deviation, so extremes stand out clearly across cycles. A green accumulation band sits at the bottom, a red distribution band up top.
Below-Realized flag — when Market Cap drops below Realized Cap (price below the average cost basis of the whole market), the background shades green. This is the core bottom condition and the reason the tool leans the way it does.
BETTER FOR BOTTOMS THAN TOPS — READ THIS
Be clear on how to use this: it is a far more reliable bottom-picker than top-picker.
The bottom signal is grounded in something real and hard to fake — when price falls below the market's aggregate cost basis, the average holder is underwater, and that level of capitulation has marked every major Bitcoin bottom to date. It's a rare, high-conviction condition. When the Z-Score sinks into the green zone or the background flags below-realized, history says you are near a generational buying area.
The top signal is looser. Cycle tops have printed at very different Z-Score peaks as the asset has matured — each cycle tends to top at a lower Z-Score than the last as Bitcoin grows and volatility compresses. So the red band is a "getting expensive, take note" warning, not a precise sell trigger. Treat a green-zone reading as a strong signal to accumulate; treat a red-zone reading as a caution flag to pair with your own confirmation, never as a standalone exit.
In short: lean on it hard at the bottoms, lean on it lightly at the tops.
HOW TO USE IT
Run it on BTCUSD (or INDEX:BTCUSD / BLX for the longest history). Watch for the orange Z-Score entering the green band or the green background appearing — those are your accumulation windows. Use the red band as an overvaluation caution rather than a timed top. You can toggle between the Z-Score and the raw MVRV ratio, and adjust the zone thresholds to your own cycle read.
NOTES
This relies on TradingView's on-chain data feed. If the on-chain series don't resolve on your plan, the tool shows a notice instead of plotting approximate data — it will never fake the metric. Because Realized Cap is Bitcoin-specific, this is a BTC-only tool.
Valuation extremes tell you when, roughly, not exactly. Bottoms are a zone, not a single day, and tops even more so. Use this as a cycle-position framework alongside your own analysis, not as a standalone buy/sell signal.
For educational and analytical purposes only. Not financial advice.
Open-source Skript
Ganz im Sinne von TradingView hat dieser Autor sein/ihr Script als Open-Source veröffentlicht. Auf diese Weise können nun auch andere Trader das Script rezensieren und die Funktionalität überprüfen. Vielen Dank an den Autor! Sie können das Script kostenlos verwenden, aber eine Wiederveröffentlichung des Codes unterliegt unseren Hausregeln.

Haftungsausschluss
Die Informationen und Veröffentlichungen sind nicht als Finanz-, Anlage-, Handels- oder andere Arten von Ratschlägen oder Empfehlungen gedacht, die von TradingView bereitgestellt oder gebilligt werden, und stellen diese nicht dar. Lesen Sie mehr in den Nutzungsbedingungen.
Open-source Skript
Ganz im Sinne von TradingView hat dieser Autor sein/ihr Script als Open-Source veröffentlicht. Auf diese Weise können nun auch andere Trader das Script rezensieren und die Funktionalität überprüfen. Vielen Dank an den Autor! Sie können das Script kostenlos verwenden, aber eine Wiederveröffentlichung des Codes unterliegt unseren Hausregeln.
Haftungsausschluss
Die Informationen und Veröffentlichungen sind nicht als Finanz-, Anlage-, Handels- oder andere Arten von Ratschlägen oder Empfehlungen gedacht, die von TradingView bereitgestellt oder gebilligt werden, und stellen diese nicht dar. Lesen Sie mehr in den Nutzungsbedingungen.