OPEN-SOURCE SCRIPT
Coinbase Bitcoin Premium Index
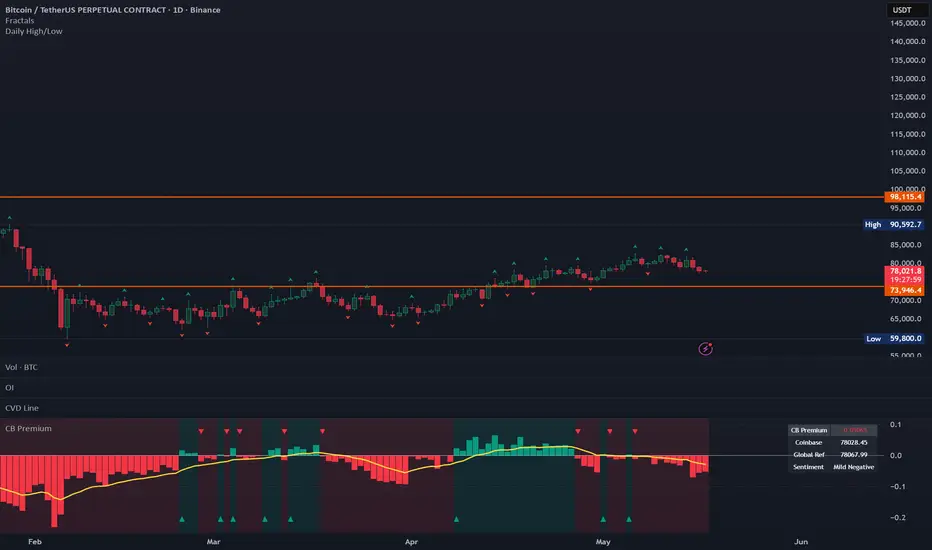
Coinbase Bitcoin Premium Index — Simple Explanation
What is it? It simply compares the Bitcoin price on Coinbase (a major U.S. exchange) to the average Bitcoin price across the rest of the world. That difference is the "premium."
How is it calculated? Take the Coinbase price, subtract the global price, divide by the global price. That gives you a percentage that tells you how much higher or lower Coinbase is vs the rest of the world.
What does it mean?
When it's positive (above zero), Bitcoin costs more on Coinbase than elsewhere. This usually means Americans are buying aggressively, big institutions are putting money in, and the mood in the U.S. market is optimistic.
When it's negative (below zero), Bitcoin is cheaper on Coinbase than elsewhere. This usually means Americans are selling, investors are nervous, and money is leaving the market.
Why does it matter? Coinbase is the most regulated and institution-friendly exchange in the U.S. So when this index moves, it often tells you what big U.S. investors and institutions are doing, which tends to move the market.
What happened historically?
During the 2020–2021 bull run the premium stayed positive for a long time, which matched companies like Tesla and MicroStrategy buying massive amounts of Bitcoin.
During the 2022–2023 crash it turned negative often, reflecting fear and heavy selling in the U.S.
Since 2024 traders use it to compare whether Americans or Asians are driving the Bitcoin price on any given day.
Bottom line It's a simple but powerful way to see who is buying or selling Bitcoin and where the pressure is coming from.
Why I added the EMA
The raw premium bounces a lot bar to bar, it's noisy. The EMA smooths it so you can see the trend of the premium, not just the momentary spike. For example if the premium is oscillating around zero but the EMA is slowly rising, that tells you U.S. buying pressure is quietly building even if individual bars look messy.
That said, you're right to question it. For this specific indicator, many traders prefer to read it raw because:
The premium itself is already a derived/smoothed concept
Adding an EMA on top can delay signals
The zero line crossovers are more meaningful than EMA crossovers here
What serious analysts actually use with this indicator:
Divergence — price makes a new high but premium is falling = warning sign
Extended positive streaks — premium stays positive for many consecutive bars = strong institutional accumulation phase
Spike + reversal — a sudden extreme spike followed by quick reversal often precedes a price move
Correlation with funding rates — combining this with perpetual futures funding rates gives a much clearer picture of market positioning
Asian vs U.S. session comparison — checking the premium specifically during U.S. market hours vs Asian hours reveals who is driving price
What is it? It simply compares the Bitcoin price on Coinbase (a major U.S. exchange) to the average Bitcoin price across the rest of the world. That difference is the "premium."
How is it calculated? Take the Coinbase price, subtract the global price, divide by the global price. That gives you a percentage that tells you how much higher or lower Coinbase is vs the rest of the world.
What does it mean?
When it's positive (above zero), Bitcoin costs more on Coinbase than elsewhere. This usually means Americans are buying aggressively, big institutions are putting money in, and the mood in the U.S. market is optimistic.
When it's negative (below zero), Bitcoin is cheaper on Coinbase than elsewhere. This usually means Americans are selling, investors are nervous, and money is leaving the market.
Why does it matter? Coinbase is the most regulated and institution-friendly exchange in the U.S. So when this index moves, it often tells you what big U.S. investors and institutions are doing, which tends to move the market.
What happened historically?
During the 2020–2021 bull run the premium stayed positive for a long time, which matched companies like Tesla and MicroStrategy buying massive amounts of Bitcoin.
During the 2022–2023 crash it turned negative often, reflecting fear and heavy selling in the U.S.
Since 2024 traders use it to compare whether Americans or Asians are driving the Bitcoin price on any given day.
Bottom line It's a simple but powerful way to see who is buying or selling Bitcoin and where the pressure is coming from.
Why I added the EMA
The raw premium bounces a lot bar to bar, it's noisy. The EMA smooths it so you can see the trend of the premium, not just the momentary spike. For example if the premium is oscillating around zero but the EMA is slowly rising, that tells you U.S. buying pressure is quietly building even if individual bars look messy.
That said, you're right to question it. For this specific indicator, many traders prefer to read it raw because:
The premium itself is already a derived/smoothed concept
Adding an EMA on top can delay signals
The zero line crossovers are more meaningful than EMA crossovers here
What serious analysts actually use with this indicator:
Divergence — price makes a new high but premium is falling = warning sign
Extended positive streaks — premium stays positive for many consecutive bars = strong institutional accumulation phase
Spike + reversal — a sudden extreme spike followed by quick reversal often precedes a price move
Correlation with funding rates — combining this with perpetual futures funding rates gives a much clearer picture of market positioning
Asian vs U.S. session comparison — checking the premium specifically during U.S. market hours vs Asian hours reveals who is driving price
Open-source Skript
Ganz im Sinne von TradingView hat dieser Autor sein/ihr Script als Open-Source veröffentlicht. Auf diese Weise können nun auch andere Trader das Script rezensieren und die Funktionalität überprüfen. Vielen Dank an den Autor! Sie können das Script kostenlos verwenden, aber eine Wiederveröffentlichung des Codes unterliegt unseren Hausregeln.

Haftungsausschluss
Die Informationen und Veröffentlichungen sind nicht als Finanz-, Anlage-, Handels- oder andere Arten von Ratschlägen oder Empfehlungen gedacht, die von TradingView bereitgestellt oder gebilligt werden, und stellen diese nicht dar. Lesen Sie mehr in den Nutzungsbedingungen.
Open-source Skript
Ganz im Sinne von TradingView hat dieser Autor sein/ihr Script als Open-Source veröffentlicht. Auf diese Weise können nun auch andere Trader das Script rezensieren und die Funktionalität überprüfen. Vielen Dank an den Autor! Sie können das Script kostenlos verwenden, aber eine Wiederveröffentlichung des Codes unterliegt unseren Hausregeln.
Haftungsausschluss
Die Informationen und Veröffentlichungen sind nicht als Finanz-, Anlage-, Handels- oder andere Arten von Ratschlägen oder Empfehlungen gedacht, die von TradingView bereitgestellt oder gebilligt werden, und stellen diese nicht dar. Lesen Sie mehr in den Nutzungsbedingungen.