Volume Expansions
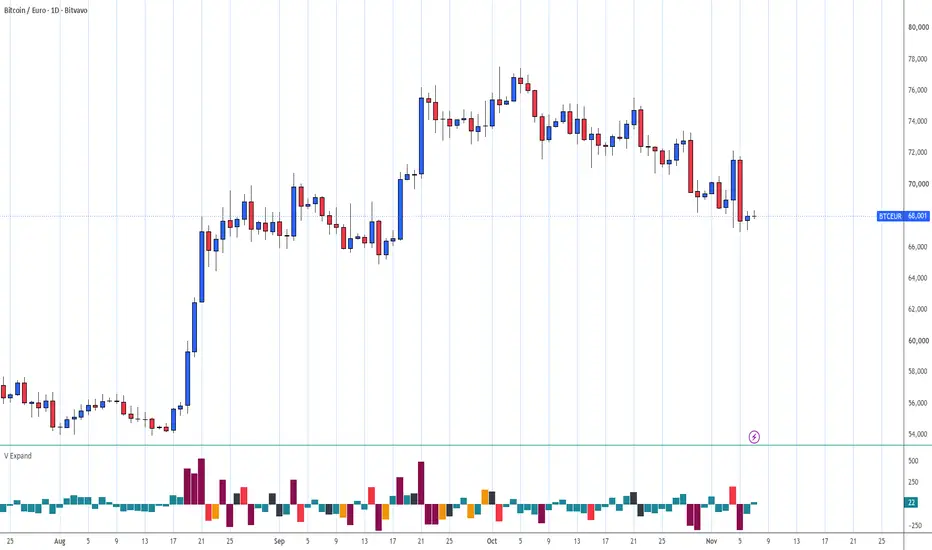
The code for this script is for the most part copied from REVE Moves (published as TZ-REVE), where it functions to create the triangles pointing up and down. In this indicator it creates columns pointing up and down, with the same color as these triangles. Added are columns pointing up and down in a blue-grayish color for all the volumes below 120 percent. (In REVE moves these volumes are not presented.)
The median volume for 50 periods is taken as 100 percent.
the other colors have the following meaning:
black 120% - 150%, relatively much volume
orange 150% - 180%, relatively high volume
red 180% - 210%, relatively huge volume
maroon 210% and more, relatively extreme volume
The up and down direction is calculated as follows:
When the current close is higher than the highest of two previous ones, direction is up.
otherwise it's down.
Use of the indicator
I use it as a second indicator combined with REVE Moves, This combination provides a clear tool to analyse relative range and relative volume.
Apart, on its own, it provides a very nice insight in the volume history of the market. You clearly see where the market is agitated and where the trading is thin.
Because the volume is relative, this is also very useful in intra day charts.
The median volume for 50 periods is taken as 100 percent.
the other colors have the following meaning:
black 120% - 150%, relatively much volume
orange 150% - 180%, relatively high volume
red 180% - 210%, relatively huge volume
maroon 210% and more, relatively extreme volume
The up and down direction is calculated as follows:
When the current close is higher than the highest of two previous ones, direction is up.
otherwise it's down.
Use of the indicator
I use it as a second indicator combined with REVE Moves, This combination provides a clear tool to analyse relative range and relative volume.
Apart, on its own, it provides a very nice insight in the volume history of the market. You clearly see where the market is agitated and where the trading is thin.
Because the volume is relative, this is also very useful in intra day charts.

Haftungsausschluss
Die Informationen und Veröffentlichungen sind nicht als Finanz-, Anlage-, Handels- oder andere Arten von Ratschlägen oder Empfehlungen gedacht, die von TradingView bereitgestellt oder gebilligt werden, und stellen diese nicht dar. Lesen Sie mehr in den Nutzungsbedingungen.
Haftungsausschluss
Die Informationen und Veröffentlichungen sind nicht als Finanz-, Anlage-, Handels- oder andere Arten von Ratschlägen oder Empfehlungen gedacht, die von TradingView bereitgestellt oder gebilligt werden, und stellen diese nicht dar. Lesen Sie mehr in den Nutzungsbedingungen.