OPEN-SOURCE SCRIPT
Intermarket Flow Oscillator
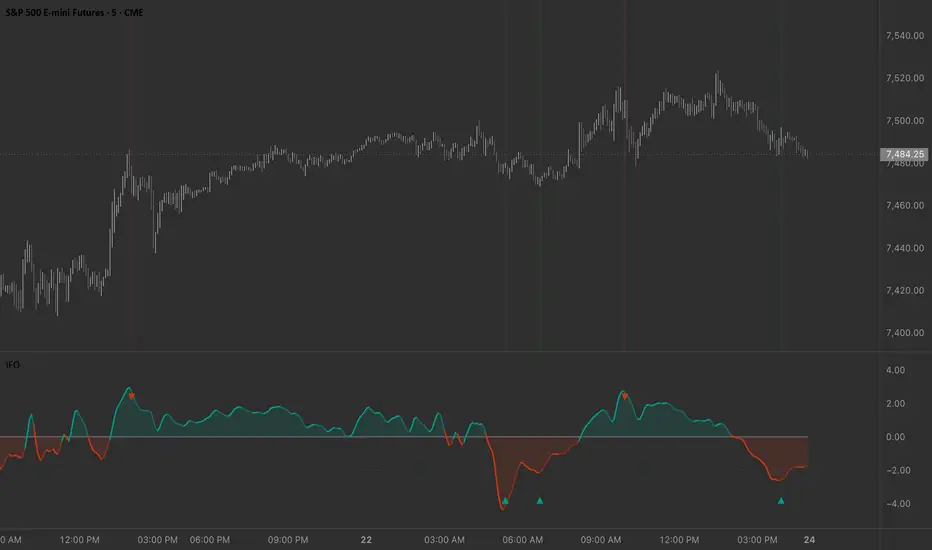
Advanced Macro Regime Tracking & Apex Reversal Detection
What is the Intermarket Flow Oscillator (IFO)?
The Intermarket Flow Oscillator (IFO) is a quantitative momentum tool designed to track capital rotation between risk-on assets (growth, equities) and risk-off assets (defensives, bonds, safe havens). By utilizing advanced statistical normalization and John Ehlers' digital signal processing, the IFO visualizes structural market regimes and pinpoints high-probability exhaustion reversals.
Whether you are trading swing setups on the daily chart or monitoring intraday capital flows, the IFO acts as a macro compass to keep you on the right side of institutional money.
The Mathematical Engine
Traditional spread indicators suffer from noise and asymmetric scaling. The IFO solves this using a two-step quantitative process:
How to Read the Signals
Practical Trading Application: Sector Rotation (XLK vs. XLP)
While the default script pairs S&P 500 Futures (ES) against 10-Year Treasuries (ZN), the true power of the IFO shines in sector rotation.
The Setup: Set the Risk Asset to XLK (Technology) and the Safe Haven to XLP (Consumer Staples).
The Logic: XLK represents high-beta, duration-sensitive growth (Apple, Microsoft, Nvidia). XLP represents inelastic consumer demand (Procter & Gamble, Walmart). This spread is the ultimate risk-on/risk-off gauge.
Key Features & Customization
What is the Intermarket Flow Oscillator (IFO)?
The Intermarket Flow Oscillator (IFO) is a quantitative momentum tool designed to track capital rotation between risk-on assets (growth, equities) and risk-off assets (defensives, bonds, safe havens). By utilizing advanced statistical normalization and John Ehlers' digital signal processing, the IFO visualizes structural market regimes and pinpoints high-probability exhaustion reversals.
Whether you are trading swing setups on the daily chart or monitoring intraday capital flows, the IFO acts as a macro compass to keep you on the right side of institutional money.
The Mathematical Engine
Traditional spread indicators suffer from noise and asymmetric scaling. The IFO solves this using a two-step quantitative process:
- Z-Score Normalization: The script calculates the natural log ratio of a Risk Asset versus a Safe Haven asset, then applies a rolling Z-Score. This transforms the intermarket spread into a stationary stochastic process, making standard deviation thresholds mathematically reliable.
- John Ehlers' 2-Pole SuperSmoother: To eliminate high-frequency market noise without introducing the severe phase lag typical of moving averages, the Z-Score is passed through an advanced DSP filter.
How to Read the Signals
- Trend Shifts & Structural Regimes (The Zero-Line)
The smoothed oscillator crossing the zero equilibrium line indicates a macro shift in capital allocation.
Green Cloud (IFO > 0): Structural Risk-On Regime. Institutions are accumulating risk/growth. Traders should look for long momentum setups and favor high-beta assets.
Red Cloud (IFO < 0): Structural Risk-Off Regime. Capital is fleeing to safety. Traders should focus on cash preservation, defensive value, or short setups. - Apex Mean-Reversion Turns (▲ and ▼)
The script calculates the first derivative (Velocity) of the smoothed capital flow. When the oscillator reaches extreme statistical exhaustion thresholds (default ±1.5 standard deviations) and the velocity flips, the IFO prints a high-contrast triangle.
Bullish Apex (▲): Occurs deep in negative territory (panic/capitulation). Represents a mathematically optimal exhaustion point where selling pressure is dying. Excellent for buying the bottom in growth stocks.
Bearish Apex (▼): Occurs high in positive territory (euphoria). Represents exhaustion in risk-taking and serves as an early warning to take profits or look for short entries.
Practical Trading Application: Sector Rotation (XLK vs. XLP)
While the default script pairs S&P 500 Futures (ES) against 10-Year Treasuries (ZN), the true power of the IFO shines in sector rotation.
The Setup: Set the Risk Asset to XLK (Technology) and the Safe Haven to XLP (Consumer Staples).
The Logic: XLK represents high-beta, duration-sensitive growth (Apple, Microsoft, Nvidia). XLP represents inelastic consumer demand (Procter & Gamble, Walmart). This spread is the ultimate risk-on/risk-off gauge.
Key Features & Customization
- Customizable Pairs: Fully adjustable inputs to test different macro pairs (e.g., BTC vs. Gold, BTCUSDT.P vs. USDT, Discretionary vs. Utilities, High Yield Bonds vs. Treasuries).
- Dynamic Coloring: The oscillator line shifts between bright/faded colors based on momentum velocity, giving you a visual cue before a crossover even happens.
Open-source Skript
Ganz im Sinne von TradingView hat dieser Autor sein/ihr Script als Open-Source veröffentlicht. Auf diese Weise können nun auch andere Trader das Script rezensieren und die Funktionalität überprüfen. Vielen Dank an den Autor! Sie können das Script kostenlos verwenden, aber eine Wiederveröffentlichung des Codes unterliegt unseren Hausregeln.

Haftungsausschluss
Die Informationen und Veröffentlichungen sind nicht als Finanz-, Anlage-, Handels- oder andere Arten von Ratschlägen oder Empfehlungen gedacht, die von TradingView bereitgestellt oder gebilligt werden, und stellen diese nicht dar. Lesen Sie mehr in den Nutzungsbedingungen.
Open-source Skript
Ganz im Sinne von TradingView hat dieser Autor sein/ihr Script als Open-Source veröffentlicht. Auf diese Weise können nun auch andere Trader das Script rezensieren und die Funktionalität überprüfen. Vielen Dank an den Autor! Sie können das Script kostenlos verwenden, aber eine Wiederveröffentlichung des Codes unterliegt unseren Hausregeln.
Haftungsausschluss
Die Informationen und Veröffentlichungen sind nicht als Finanz-, Anlage-, Handels- oder andere Arten von Ratschlägen oder Empfehlungen gedacht, die von TradingView bereitgestellt oder gebilligt werden, und stellen diese nicht dar. Lesen Sie mehr in den Nutzungsbedingungen.