MTF Trend Dashboard, Buy Sell Signals & Bias Alignment [LunqFX]
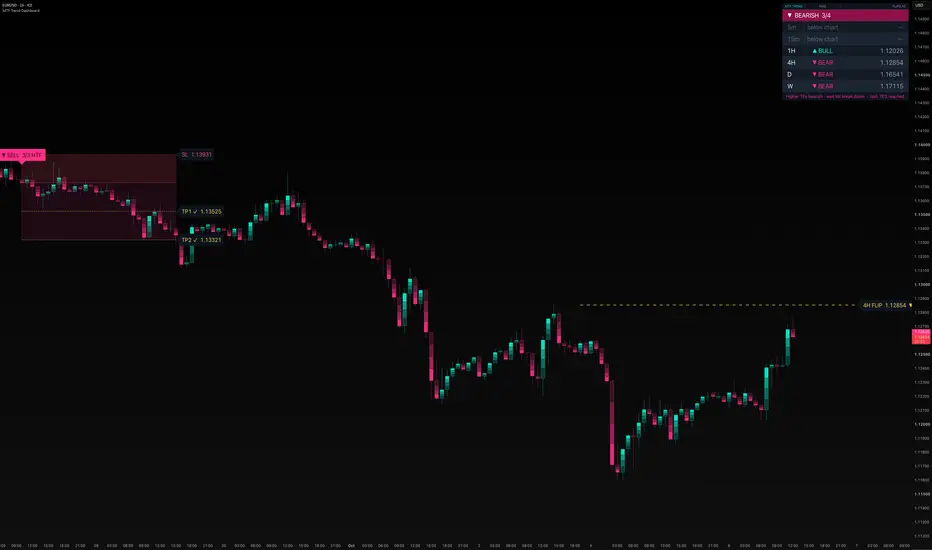
MTF Trend Dashboard shows the trend of six timeframes in one panel — from 5 minutes to the weekly — and prints buy and sell signals with the stop loss and two take-profit targets when the higher timeframes agree. Multi timeframe bias for forex, gold (XAUUSD), indices and crypto.
Most multi-timeframe dashboards colour each cell by a moving average and stop there. This one reads market structure on every timeframe: the trend is up after a candle closes above the last swing high and stays up until a candle closes below the last swing low. Because the bias comes from structure, every timeframe also has a concrete price that would flip it — the swing that defends the trend — and the dashboard prints that FLIP level for each timeframe. You see not only which way each timeframe points, but exactly where it would stop pointing that way.
Included: structure bias on six timeframes, the flip level of each, an alignment score, flip levels of two higher timeframes drawn on the chart, buy and sell signals when the chart's structure breaks in the direction the higher timeframes agree on, a stop and two targets for every signal, and alerts.
❶ THE BIAS ENGINE
The same engine runs on all six timeframes. Swing highs and lows are confirmed pivots with a fixed number of bars on each side. A close above the last swing high turns the bias up; a close below the last swing low turns it down; until either happens the bias stays as it was. A timeframe that has not yet broken any swing reads FLAT. The bias of each timeframe changes only when a candle of that timeframe has closed.
The FLIP level is the swing that would reverse the current bias: the last swing low while the bias is up, the last swing high while it is down.
❷ ALIGNMENT
The header counts how many timeframes at or above the chart's agree — "▲ BULLISH 5/6". Timeframes below the chart's are shown as "below chart" and are not counted, because a higher-timeframe chart cannot read them honestly.
❸ SIGNALS
A buy signal needs two things on the same closed bar. First, the higher timeframes — only those strictly above the chart's — agree: at least the number you set (3 by default) are bullish, and more are bullish than bearish. Second, the chart itself breaks structure upward: a candle closes above the chart's last swing high. Sell is the mirror. Each swing can trigger only once.
Stop — beyond the swing on the other side of the break, plus an ATR buffer, and never tighter than a minimum distance in ATR. If the stop would be wider than the maximum distance in ATR, the signal is skipped. Targets — TP1 and TP2 at 1R and 2R of that stop by default, both adjustable.
The signal label shows how many higher timeframes agreed, for example "▲ BUY 3/4 HTF". The plan is followed until the stop or TP2; targets reached are ticked on their tags.
HOW TO USE IT
1 — Read the header first. A bullish header with most timeframes agreeing is the environment for buys; a mixed header means the timeframes disagree and no signal will print.
2 — Use the FLIP column as your invalidation map. If price is close to the 4H flip level, the 4H trend is close to turning — a buy taken there has less room.
3 — Take signals in the direction of the header. The bottom line of the panel tells you what the tool is waiting for: "Higher TFs bullish · wait for break up".
4 — Choose the timeframes for your style. Scalpers can use 1m–4H, swing traders 1H–monthly. Only timeframes above the chart count for signals.
HOW IT WORKS
The structure engine is one function passed to request.security once per timeframe; each call keeps its own swing highs, swing lows and bias, and only updates them on a closed bar of its own timeframe. The chart's structure is tracked separately as the trigger. On every closed chart bar the script counts the agreeing higher timeframes, checks for a break of the chart's swing, sizes the stop from the opposite swing and the ATR limits, and places the targets as multiples of that stop. Requests use lookahead off.
LIMITATIONS — read before relying on it
▸ Structure bias reacts late by design: a swing is only confirmed several bars after it forms, and the bias turns only on a close beyond it. Sharp V-shaped reversals are recognised after the move has started.
▸ In ranges, structure breaks both ways. The higher timeframes then disagree and signals stop, but the chart timeframe can still flip back and forth.
▸ Higher-timeframe bias updates when that timeframe's candle closes. During a 4H or daily candle the dashboard shows the bias as of the last closed candle.
▸ Targets are fixed multiples of the stop and do not look at the next level of support or resistance.
▸ When one bar touches both the stop and a target, it is recorded as stopped.
▸ Signals appear on the close of the breaking bar. Between that close and your order, price can already have moved.
▸ The ticks on targets describe individual signals. They are not collected into a win rate, and nothing here is a statement about future results.
WHY IT IS ORIGINAL
Multi-timeframe dashboards are common, and almost all of them measure each timeframe with a moving average. This one measures structure, which gives every timeframe a defined invalidation price — the flip level — that an average cannot provide. The dashboard turns that into a map of where each timeframe's trend would end, and the signals use it as a filter for the chart's own structure breaks.
It is not a version of my other scripts. Market Structure shows swing points and breaks on the chart's timeframe only. Trade Planner trades pullbacks to a moving average and sizes the position. This script measures structure across six timeframes and trades the chart's breaks only when they agree.
SETTINGS
▸ Timeframes — six timeframes and the swing length used on all of them. ▸ Signals — on/off, how many higher timeframes must agree, chart swing length, stop buffer, minimum and maximum stop in ATR, TP1 and TP2 in R. ▸ Visuals — five candle palettes plus off, glow candles (each body drawn in four bands that brighten towards the close; colours shift one shade deeper on a light chart), flip levels of timeframes 4 and 5 on the chart, text size of signals and levels, signals kept on the chart, dashboard position and text size.
ALERTS — buy and sell (the message carries entry, stop, both targets and the number of agreeing timeframes), target reached, stop reached, all timeframes bullish, all timeframes bearish. Create them as "Any alert() function call", or use the four classic alert conditions.
NON-REPAINTING — every timeframe's bias changes only after that timeframe's candle closes; signals, stops and targets are decided on closed bars, and a printed signal never moves.
This indicator is an educational tool for reading multi-timeframe trend. It is not financial advice and it does not predict price. Always confirm with your own analysis and manage your risk.
Most multi-timeframe dashboards colour each cell by a moving average and stop there. This one reads market structure on every timeframe: the trend is up after a candle closes above the last swing high and stays up until a candle closes below the last swing low. Because the bias comes from structure, every timeframe also has a concrete price that would flip it — the swing that defends the trend — and the dashboard prints that FLIP level for each timeframe. You see not only which way each timeframe points, but exactly where it would stop pointing that way.
Included: structure bias on six timeframes, the flip level of each, an alignment score, flip levels of two higher timeframes drawn on the chart, buy and sell signals when the chart's structure breaks in the direction the higher timeframes agree on, a stop and two targets for every signal, and alerts.
❶ THE BIAS ENGINE
The same engine runs on all six timeframes. Swing highs and lows are confirmed pivots with a fixed number of bars on each side. A close above the last swing high turns the bias up; a close below the last swing low turns it down; until either happens the bias stays as it was. A timeframe that has not yet broken any swing reads FLAT. The bias of each timeframe changes only when a candle of that timeframe has closed.
The FLIP level is the swing that would reverse the current bias: the last swing low while the bias is up, the last swing high while it is down.
❷ ALIGNMENT
The header counts how many timeframes at or above the chart's agree — "▲ BULLISH 5/6". Timeframes below the chart's are shown as "below chart" and are not counted, because a higher-timeframe chart cannot read them honestly.
❸ SIGNALS
A buy signal needs two things on the same closed bar. First, the higher timeframes — only those strictly above the chart's — agree: at least the number you set (3 by default) are bullish, and more are bullish than bearish. Second, the chart itself breaks structure upward: a candle closes above the chart's last swing high. Sell is the mirror. Each swing can trigger only once.
Stop — beyond the swing on the other side of the break, plus an ATR buffer, and never tighter than a minimum distance in ATR. If the stop would be wider than the maximum distance in ATR, the signal is skipped. Targets — TP1 and TP2 at 1R and 2R of that stop by default, both adjustable.
The signal label shows how many higher timeframes agreed, for example "▲ BUY 3/4 HTF". The plan is followed until the stop or TP2; targets reached are ticked on their tags.
HOW TO USE IT
1 — Read the header first. A bullish header with most timeframes agreeing is the environment for buys; a mixed header means the timeframes disagree and no signal will print.
2 — Use the FLIP column as your invalidation map. If price is close to the 4H flip level, the 4H trend is close to turning — a buy taken there has less room.
3 — Take signals in the direction of the header. The bottom line of the panel tells you what the tool is waiting for: "Higher TFs bullish · wait for break up".
4 — Choose the timeframes for your style. Scalpers can use 1m–4H, swing traders 1H–monthly. Only timeframes above the chart count for signals.
HOW IT WORKS
The structure engine is one function passed to request.security once per timeframe; each call keeps its own swing highs, swing lows and bias, and only updates them on a closed bar of its own timeframe. The chart's structure is tracked separately as the trigger. On every closed chart bar the script counts the agreeing higher timeframes, checks for a break of the chart's swing, sizes the stop from the opposite swing and the ATR limits, and places the targets as multiples of that stop. Requests use lookahead off.
LIMITATIONS — read before relying on it
▸ Structure bias reacts late by design: a swing is only confirmed several bars after it forms, and the bias turns only on a close beyond it. Sharp V-shaped reversals are recognised after the move has started.
▸ In ranges, structure breaks both ways. The higher timeframes then disagree and signals stop, but the chart timeframe can still flip back and forth.
▸ Higher-timeframe bias updates when that timeframe's candle closes. During a 4H or daily candle the dashboard shows the bias as of the last closed candle.
▸ Targets are fixed multiples of the stop and do not look at the next level of support or resistance.
▸ When one bar touches both the stop and a target, it is recorded as stopped.
▸ Signals appear on the close of the breaking bar. Between that close and your order, price can already have moved.
▸ The ticks on targets describe individual signals. They are not collected into a win rate, and nothing here is a statement about future results.
WHY IT IS ORIGINAL
Multi-timeframe dashboards are common, and almost all of them measure each timeframe with a moving average. This one measures structure, which gives every timeframe a defined invalidation price — the flip level — that an average cannot provide. The dashboard turns that into a map of where each timeframe's trend would end, and the signals use it as a filter for the chart's own structure breaks.
It is not a version of my other scripts. Market Structure shows swing points and breaks on the chart's timeframe only. Trade Planner trades pullbacks to a moving average and sizes the position. This script measures structure across six timeframes and trades the chart's breaks only when they agree.
SETTINGS
▸ Timeframes — six timeframes and the swing length used on all of them. ▸ Signals — on/off, how many higher timeframes must agree, chart swing length, stop buffer, minimum and maximum stop in ATR, TP1 and TP2 in R. ▸ Visuals — five candle palettes plus off, glow candles (each body drawn in four bands that brighten towards the close; colours shift one shade deeper on a light chart), flip levels of timeframes 4 and 5 on the chart, text size of signals and levels, signals kept on the chart, dashboard position and text size.
ALERTS — buy and sell (the message carries entry, stop, both targets and the number of agreeing timeframes), target reached, stop reached, all timeframes bullish, all timeframes bearish. Create them as "Any alert() function call", or use the four classic alert conditions.
NON-REPAINTING — every timeframe's bias changes only after that timeframe's candle closes; signals, stops and targets are decided on closed bars, and a printed signal never moves.
This indicator is an educational tool for reading multi-timeframe trend. It is not financial advice and it does not predict price. Always confirm with your own analysis and manage your risk.

Trade setups with clear entry, stop, target and risk logic. Built for traders who want structure, not guessing.
💬 t.me/lunqfx
🌐 lunqfx.com/premium
💬 t.me/lunqfx
🌐 lunqfx.com/premium
Haftungsausschluss
Die Informationen und Veröffentlichungen sind nicht als Finanz-, Anlage-, Handels- oder andere Arten von Ratschlägen oder Empfehlungen gedacht, die von TradingView bereitgestellt oder gebilligt werden, und stellen diese nicht dar. Lesen Sie mehr in den Nutzungsbedingungen.
Trade setups with clear entry, stop, target and risk logic. Built for traders who want structure, not guessing.
💬 t.me/lunqfx
🌐 lunqfx.com/premium
💬 t.me/lunqfx
🌐 lunqfx.com/premium
Haftungsausschluss
Die Informationen und Veröffentlichungen sind nicht als Finanz-, Anlage-, Handels- oder andere Arten von Ratschlägen oder Empfehlungen gedacht, die von TradingView bereitgestellt oder gebilligt werden, und stellen diese nicht dar. Lesen Sie mehr in den Nutzungsbedingungen.