OPEN-SOURCE SCRIPT
Aktualisiert GMS Ultimate Indicator
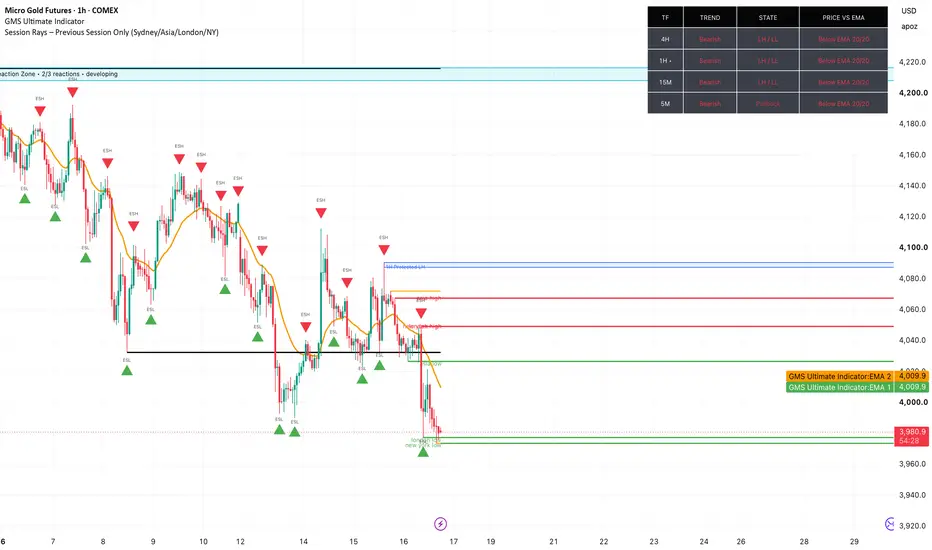
GMS Ultimate Indicator 9.0 is a customizable multi timeframe market structure and price action tool designed to help traders stay aligned with the dominant side of the market.
It analyzes the Daily, 4H, 1H, 15M, 5M, and 1M trends using HH/HL and LH/LL structure, while identifying pullbacks, consolidation, liquidity sweeps, BOS, CHOCH, protected structure, reaction zones, retests, and rejection candles. Its setup engine helps locate higher probability entries within the broader trend, with adjustable alerts, dashboard layouts, and display settings.
For analysis and educational purposes only. Use proper risk management and backtesting.
It analyzes the Daily, 4H, 1H, 15M, 5M, and 1M trends using HH/HL and LH/LL structure, while identifying pullbacks, consolidation, liquidity sweeps, BOS, CHOCH, protected structure, reaction zones, retests, and rejection candles. Its setup engine helps locate higher probability entries within the broader trend, with adjustable alerts, dashboard layouts, and display settings.
For analysis and educational purposes only. Use proper risk management and backtesting.
Versionshinweise
GMS Ultimate Indicator is a customizable multi timeframe market structure and price action tool designed to help traders stay aligned with the market’s direction. It tracks 4H, 1H, 15M, and 5M trend conditions, structure state, and price position relative to selected EMAs.The indicator also identifies BOS, CHOCH, swing highs and lows, liquidity pools and sweeps, previous day/week levels, protected 1H structure, 4H reaction zones, retests, rejection candles, potential setups, targets, and alerts.
Built for scalpers, intraday traders, and swing traders who use market structure and price action. For analysis and educational purposes only.
Versionshinweise
GMS Ultimate Indicator is a customizable multi timeframe market structure and price action tool designed to help traders stay aligned with the market’s direction. It tracks 4H, 1H, 15M, and 5M trend conditions, structure state, and price position relative to selected EMAs.The indicator also identifies BOS, CHOCH, swing highs and lows, liquidity pools and sweeps, previous day/week levels, protected 1H structure, 4H reaction zones, retests, rejection candles, potential setups, targets, and alerts.
Built for scalpers, intraday traders, and swing traders who use market structure and price action. For analysis and educational purposes only.
Versionshinweise
GMS Ultimate Indicator is a customizable multi timeframe market structure and price action tool designed to help traders stay aligned with the market’s direction. It tracks 4H, 1H, 15M, and 5M trend conditions, structure state, and price position relative to selected EMAs.The indicator also identifies BOS, CHOCH, swing highs and lows, liquidity pools and sweeps, previous day/week levels, protected 1H structure, 4H reaction zones, retests, rejection candles, potential setups, targets, and alerts.
Built for scalpers, intraday traders, and swing traders who use market structure and price action. For analysis and educational purposes only.
Versionshinweise
GMS Ultimate Indicator is a customizable multi timeframe market structure and price action tool designed to help traders stay aligned with the market’s direction. It tracks 4H, 1H, 15M, and 5M trend conditions, structure state, and price position relative to selected EMAs.The indicator also identifies BOS, CHOCH, swing highs and lows, liquidity pools and sweeps, previous day/week levels, protected 1H structure, 4H reaction zones, retests, rejection candles, potential setups, targets, and alerts.
Built for scalpers, intraday traders, and swing traders who use market structure and price action. For analysis and educational purposes only.
Versionshinweise
Updated : 12.9GMS Ultimate Indicator is a customizable multi timeframe market structure and price action tool designed to help traders stay aligned with the dominant side of the market.
It analyzes the Daily, 4H, 1H, 15M, 5M, and 1M trends using HH/HL and LH/LL structure, while identifying pullbacks, consolidation, liquidity sweeps, BOS, CHOCH, protected structure, reaction zones, retests, and rejection candles. Its setup engine helps locate higher probability entries within the broader trend, with adjustable alerts, dashboard layouts, and display settings.
For analysis and educational purposes only. Use proper risk management and backtesting.
Versionshinweise
Updated v 13.0 GMS Ultimate Indicator is a customizable multi timeframe market structure and price action tool designed to help traders stay aligned with the dominant side of the market.
It analyzes the Daily, 4H, 1H, 15M, 5M, and 1M trends using HH/HL and LH/LL structure, while identifying pullbacks, consolidation, liquidity sweeps, BOS, CHOCH, protected structure, reaction zones, retests, and rejection candles. Its setup engine helps locate higher probability entries within the broader trend, with adjustable alerts, dashboard layouts, and display settings.
For analysis and educational purposes only. Use proper risk management and backtesting.
Open-source Skript
Ganz im Sinne von TradingView hat dieser Autor sein/ihr Script als Open-Source veröffentlicht. Auf diese Weise können nun auch andere Trader das Script rezensieren und die Funktionalität überprüfen. Vielen Dank an den Autor! Sie können das Script kostenlos verwenden, aber eine Wiederveröffentlichung des Codes unterliegt unseren Hausregeln.

Haftungsausschluss
Die Informationen und Veröffentlichungen sind nicht als Finanz-, Anlage-, Handels- oder andere Arten von Ratschlägen oder Empfehlungen gedacht, die von TradingView bereitgestellt oder gebilligt werden, und stellen diese nicht dar. Lesen Sie mehr in den Nutzungsbedingungen.
Open-source Skript
Ganz im Sinne von TradingView hat dieser Autor sein/ihr Script als Open-Source veröffentlicht. Auf diese Weise können nun auch andere Trader das Script rezensieren und die Funktionalität überprüfen. Vielen Dank an den Autor! Sie können das Script kostenlos verwenden, aber eine Wiederveröffentlichung des Codes unterliegt unseren Hausregeln.
Haftungsausschluss
Die Informationen und Veröffentlichungen sind nicht als Finanz-, Anlage-, Handels- oder andere Arten von Ratschlägen oder Empfehlungen gedacht, die von TradingView bereitgestellt oder gebilligt werden, und stellen diese nicht dar. Lesen Sie mehr in den Nutzungsbedingungen.