OPEN-SOURCE SCRIPT
H4 High Low Lines
OVERVIEW
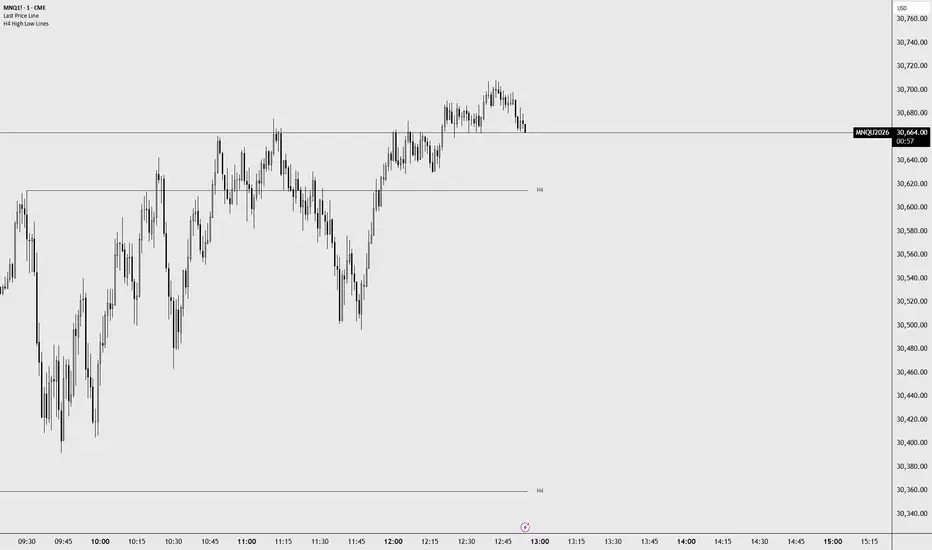
This indicator marks the high and low of the last N completed 4-hour candles on any chart timeframe (1m, 5m, 15m, 4H, etc.), syncing automatically to the symbol's real 4-hour session boundaries.
HOW TO USE
Add the indicator to any chart. Two lines are drawn for each completed 4H candle: one at the wick high, one at the wick low. Each line starts exactly at the bar where that high or low occurred, extends a configurable distance ahead of price, and is labeled "H4" to the right.
Use the "Max H4 Candles to Show" input to choose how many recent 4H candles to display (1 to 10, default 2). Line color, width, style, label text, label color, label size, extend length, and label gap are all configurable in the inputs.
LIMITATIONS
The script relies on a non-repainting multi-timeframe request to the native 240 ("240" minute / 4H) series. Because of this, on a realtime bar the script waits for the underlying 4H bar to be confirmed before drawing it, which introduces a small delay relative to the moment the 4H candle actually closes. This is expected behavior for non-repainting higher-timeframe requests and is not a bug.
NOTES
This script uses the request.security() offset-and-lookahead technique documented by PineCoders in their "Higher-timeframe requests" publication to avoid repainting and ensure consistent timing across historical and live bars.
This indicator marks the high and low of the last N completed 4-hour candles on any chart timeframe (1m, 5m, 15m, 4H, etc.), syncing automatically to the symbol's real 4-hour session boundaries.
HOW TO USE
Add the indicator to any chart. Two lines are drawn for each completed 4H candle: one at the wick high, one at the wick low. Each line starts exactly at the bar where that high or low occurred, extends a configurable distance ahead of price, and is labeled "H4" to the right.
Use the "Max H4 Candles to Show" input to choose how many recent 4H candles to display (1 to 10, default 2). Line color, width, style, label text, label color, label size, extend length, and label gap are all configurable in the inputs.
LIMITATIONS
The script relies on a non-repainting multi-timeframe request to the native 240 ("240" minute / 4H) series. Because of this, on a realtime bar the script waits for the underlying 4H bar to be confirmed before drawing it, which introduces a small delay relative to the moment the 4H candle actually closes. This is expected behavior for non-repainting higher-timeframe requests and is not a bug.
NOTES
This script uses the request.security() offset-and-lookahead technique documented by PineCoders in their "Higher-timeframe requests" publication to avoid repainting and ensure consistent timing across historical and live bars.
Open-source Skript
Ganz im Sinne von TradingView hat dieser Autor sein/ihr Script als Open-Source veröffentlicht. Auf diese Weise können nun auch andere Trader das Script rezensieren und die Funktionalität überprüfen. Vielen Dank an den Autor! Sie können das Script kostenlos verwenden, aber eine Wiederveröffentlichung des Codes unterliegt unseren Hausregeln.

Haftungsausschluss
Die Informationen und Veröffentlichungen sind nicht als Finanz-, Anlage-, Handels- oder andere Arten von Ratschlägen oder Empfehlungen gedacht, die von TradingView bereitgestellt oder gebilligt werden, und stellen diese nicht dar. Lesen Sie mehr in den Nutzungsbedingungen.
Open-source Skript
Ganz im Sinne von TradingView hat dieser Autor sein/ihr Script als Open-Source veröffentlicht. Auf diese Weise können nun auch andere Trader das Script rezensieren und die Funktionalität überprüfen. Vielen Dank an den Autor! Sie können das Script kostenlos verwenden, aber eine Wiederveröffentlichung des Codes unterliegt unseren Hausregeln.
Haftungsausschluss
Die Informationen und Veröffentlichungen sind nicht als Finanz-, Anlage-, Handels- oder andere Arten von Ratschlägen oder Empfehlungen gedacht, die von TradingView bereitgestellt oder gebilligt werden, und stellen diese nicht dar. Lesen Sie mehr in den Nutzungsbedingungen.