OPEN-SOURCE SCRIPT
Aktualisiert Distributional Shift Sentinel Wasserstein Regime Monitor
Distributional-Shift Sentinel — Wasserstein Regime Monitor
Detects when the SHAPE of returns changes — not just the average or the variance. It claims a change, never a direction.
What it does
Most regime tools watch a moving average or a volatility band, so they only react to changes in LEVEL or SPREAD. But a market can keep the same mean and variance while its return distribution quietly changes shape — skew flips, tails fatten, the character of the auction turns. Those are the shifts that moment-based tools see late. This sentinel compares the recent return distribution against a reference window using the Wasserstein-1 ("earth-mover") distance — a metric sensitive to the whole shape — and raises a flag when the shape has moved unusually far.
How it works, and why these components together
This is a deliberate synthesis of three parts, each covering the previous one's weakness:
The Wasserstein-1 distance (optimal-transport statistics: Monge; Kantorovich). For one-dimensional data it is simply the average gap between the two windows' matched order-statistics: sort both return windows and average the absolute differences. Unlike KL/JS divergence it registers both the location and the magnitude of the difference, so a fattening tail or a skew flip shows up even when mean and variance are unchanged. Weakness it leaves open: the raw number is meaningless in isolation — "0.4" is not a shift.
A self-calibrated alarm. The distance is normalized by the reference dispersion (comparable across symbols) and ranked against its own recent history; a shift is flagged only when the reading is unusually large for this symbol and timeframe (percentile input). No fixed magic threshold. Weakness it leaves open: readings near the alarm line flicker.
A minimum-dwell announcement filter (the standard anti-chattering design from switched-systems control): SHIFT/STABLE is announced only after surviving a set number of confirmed bars. Cost: that many bars of lag — stated and adjustable.
When a shift fires, the dashboard decomposes it into what moved — location (median), scale (dispersion), shape (skew) — so the flag is informative, not just a light.
How to read it (all visuals)
Shift lane — the thin strip at the pane bottom: amber = distribution shifted, green = stable. Alert colors (change/normal), never direction. The one-glance read.
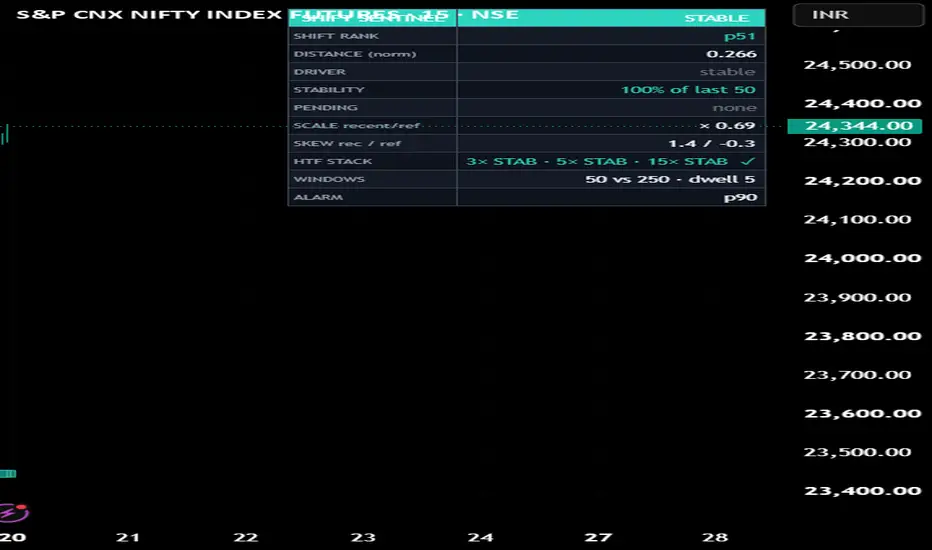
Dashboard — SHIFT/STABLE headline; shift rank; normalized distance; DRIVER (loc/scale/shape); STABILITY (% of the last 50 bars in the current state); PENDING (a forming state with countdown); windows and alarm settings.
HTF STACK — the raw shift state on three higher timeframes derived as multiples of the chart (defaults 3×, 5×, 15× — a 5m chart reads 15m/25m/75m automatically). ✓ = every timeframe agrees; ⚠ = a higher timeframe has shifted while the chart looks stable — a shape change above your resolution. Note: the deeper slots need many bars of their own timeframe (reference + calibration windows), so they warm up slowly on intraday charts; "—" for a while is correct.
SHIFT tags print on announced changes; a subtle background tint marks shifted spans.
How to use it
Treat a SHIFT as an early warning to widen stops, cut size, or re-evaluate any model or setup that assumed the old regime — not as a buy or sell. It pairs naturally with trend, structure, and fragility tools: they tell you what the regime is; this tells you when the regime's distributional character stopped being what it was. Alerts fire on shift start and shift end.
Non-repaint
Windows, the distance, the alarm, and all state announcements advance only on CONFIRMED bars; the live bar is provisional. Higher-timeframe requests use lookahead-off. No lower-timeframe data is used anywhere, so the script runs identically on every plan and symbol.
Use on any market
Price source, return type, window lengths, and the alarm percentile are all inputs; the metric is scale-relative (normalized by reference dispersion). Defaults suit liquid intraday index futures.
Originality & credits
The synthesis — sorted-sample Wasserstein-1 on a rolling chart window, dispersion normalization, self-calibrated percentile alarm, dwell-filtered state, driver decomposition, and the multi-timeframe stack — is original work for this publication. Concept credits: optimal transport / earth-mover distance — G. Monge, L. Kantorovich; Wasserstein two-sample comparison for change/drift detection — standard optimal-transport statistics literature. Implementation and charting design are the author's own.
Disclaimer
Research and education only. NOT financial advice, NOT a signal service, NOT a guarantee of future results. A detected shift is a descriptive statement about the past distribution on this chart; it does not predict direction or magnitude. Regimes change without warning. Validate independently and manage your own risk.
Detects when the SHAPE of returns changes — not just the average or the variance. It claims a change, never a direction.
What it does
Most regime tools watch a moving average or a volatility band, so they only react to changes in LEVEL or SPREAD. But a market can keep the same mean and variance while its return distribution quietly changes shape — skew flips, tails fatten, the character of the auction turns. Those are the shifts that moment-based tools see late. This sentinel compares the recent return distribution against a reference window using the Wasserstein-1 ("earth-mover") distance — a metric sensitive to the whole shape — and raises a flag when the shape has moved unusually far.
How it works, and why these components together
This is a deliberate synthesis of three parts, each covering the previous one's weakness:
The Wasserstein-1 distance (optimal-transport statistics: Monge; Kantorovich). For one-dimensional data it is simply the average gap between the two windows' matched order-statistics: sort both return windows and average the absolute differences. Unlike KL/JS divergence it registers both the location and the magnitude of the difference, so a fattening tail or a skew flip shows up even when mean and variance are unchanged. Weakness it leaves open: the raw number is meaningless in isolation — "0.4" is not a shift.
A self-calibrated alarm. The distance is normalized by the reference dispersion (comparable across symbols) and ranked against its own recent history; a shift is flagged only when the reading is unusually large for this symbol and timeframe (percentile input). No fixed magic threshold. Weakness it leaves open: readings near the alarm line flicker.
A minimum-dwell announcement filter (the standard anti-chattering design from switched-systems control): SHIFT/STABLE is announced only after surviving a set number of confirmed bars. Cost: that many bars of lag — stated and adjustable.
When a shift fires, the dashboard decomposes it into what moved — location (median), scale (dispersion), shape (skew) — so the flag is informative, not just a light.
How to read it (all visuals)
Shift lane — the thin strip at the pane bottom: amber = distribution shifted, green = stable. Alert colors (change/normal), never direction. The one-glance read.
Dashboard — SHIFT/STABLE headline; shift rank; normalized distance; DRIVER (loc/scale/shape); STABILITY (% of the last 50 bars in the current state); PENDING (a forming state with countdown); windows and alarm settings.
HTF STACK — the raw shift state on three higher timeframes derived as multiples of the chart (defaults 3×, 5×, 15× — a 5m chart reads 15m/25m/75m automatically). ✓ = every timeframe agrees; ⚠ = a higher timeframe has shifted while the chart looks stable — a shape change above your resolution. Note: the deeper slots need many bars of their own timeframe (reference + calibration windows), so they warm up slowly on intraday charts; "—" for a while is correct.
SHIFT tags print on announced changes; a subtle background tint marks shifted spans.
How to use it
Treat a SHIFT as an early warning to widen stops, cut size, or re-evaluate any model or setup that assumed the old regime — not as a buy or sell. It pairs naturally with trend, structure, and fragility tools: they tell you what the regime is; this tells you when the regime's distributional character stopped being what it was. Alerts fire on shift start and shift end.
Non-repaint
Windows, the distance, the alarm, and all state announcements advance only on CONFIRMED bars; the live bar is provisional. Higher-timeframe requests use lookahead-off. No lower-timeframe data is used anywhere, so the script runs identically on every plan and symbol.
Use on any market
Price source, return type, window lengths, and the alarm percentile are all inputs; the metric is scale-relative (normalized by reference dispersion). Defaults suit liquid intraday index futures.
Originality & credits
The synthesis — sorted-sample Wasserstein-1 on a rolling chart window, dispersion normalization, self-calibrated percentile alarm, dwell-filtered state, driver decomposition, and the multi-timeframe stack — is original work for this publication. Concept credits: optimal transport / earth-mover distance — G. Monge, L. Kantorovich; Wasserstein two-sample comparison for change/drift detection — standard optimal-transport statistics literature. Implementation and charting design are the author's own.
Disclaimer
Research and education only. NOT financial advice, NOT a signal service, NOT a guarantee of future results. A detected shift is a descriptive statement about the past distribution on this chart; it does not predict direction or magnitude. Regimes change without warning. Validate independently and manage your own risk.
Versionshinweise
v1.1 — Finishing pass (no engine change)- Cleared a Pine warning (CW10004): two smoothing averages called ta.ema from inside a
"skip while warming up" check, which Pine flags as potentially inconsistent. They now run every
bar via a seed-on-first-valid EMA that reproduces the exact same output after warm-up — only the
warning is gone.
- Added a Data Window (EXP_) export bus so the shift distance, percentile and higher-timeframe flags
can feed other scripts via input.source().
- Added the MPL-2.0 licence header.
- No change to the Wasserstein shift engine, the alarm, the multi-timeframe reads or the dashboard —
everyday behaviour is identical.
Descriptive regime-monitoring tool, not investment advice.
Open-source Skript
Ganz im Sinne von TradingView hat dieser Autor sein/ihr Script als Open-Source veröffentlicht. Auf diese Weise können nun auch andere Trader das Script rezensieren und die Funktionalität überprüfen. Vielen Dank an den Autor! Sie können das Script kostenlos verwenden, aber eine Wiederveröffentlichung des Codes unterliegt unseren Hausregeln.

Haftungsausschluss
Die Informationen und Veröffentlichungen sind nicht als Finanz-, Anlage-, Handels- oder andere Arten von Ratschlägen oder Empfehlungen gedacht, die von TradingView bereitgestellt oder gebilligt werden, und stellen diese nicht dar. Lesen Sie mehr in den Nutzungsbedingungen.
Open-source Skript
Ganz im Sinne von TradingView hat dieser Autor sein/ihr Script als Open-Source veröffentlicht. Auf diese Weise können nun auch andere Trader das Script rezensieren und die Funktionalität überprüfen. Vielen Dank an den Autor! Sie können das Script kostenlos verwenden, aber eine Wiederveröffentlichung des Codes unterliegt unseren Hausregeln.
Haftungsausschluss
Die Informationen und Veröffentlichungen sind nicht als Finanz-, Anlage-, Handels- oder andere Arten von Ratschlägen oder Empfehlungen gedacht, die von TradingView bereitgestellt oder gebilligt werden, und stellen diese nicht dar. Lesen Sie mehr in den Nutzungsbedingungen.