OPEN-SOURCE SCRIPT
Aktualisiert QuantFlow: Precision Momentum Oscillator
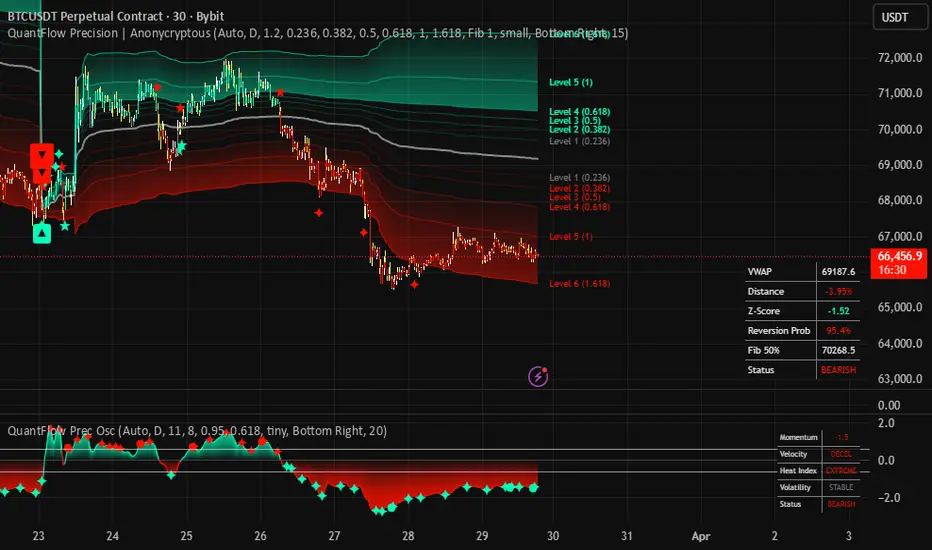
QuantFlow: Precision Momentum Oscillator
█ The Institutional Engine Room
The QuantFlow: Precision Momentum Oscillator is a professional-grade predictive engine designed to serve as the "Engine Room" for your trading chart. While the main chart shows where price is relative to value, this oscillator analyzes the velocity, quality, and exhaustion of momentum, providing signals that often precede price movement.
█ Technical Core
Zero-Lag DEMA Engine: Uses a Double Exponential Moving Average (DEMA) to eliminate the lag common in standard oscillators. This ensures that midline crosses and color flips happen in real-time with price action.
MIDAS Volume Integration: Calculations are rooted in the same cumulative volume-weighting as the QuantFlow: Precision Fibonacci VWAP, ensuring the oscillator is measuring "Smart Money" momentum rather than just retail price movement.
Adaptive Sensitivity: Defaulted to 3, specifically optimized for high-volatility 15m assets like Bitcoin, providing the fastest possible reaction time.
█ Visual Intelligence System
Momentum Wave & Gradient: A high-contrast wave that flips between Fluor Green (Bullish) and Fluor Red (Bearish). The gradient density shows the "depth" of the current momentum.
Early Warning Sparks (✦): These sparkles trigger when momentum velocity shifts before price reaches the zero-line. They are your "Get Ready" signals for an upcoming trend change.
Exhaustion Divergences (●): Tiny circles that appear on the wave to signal high-probability reversals.
Green Circle: Hidden strength (Price lower low, Momentum higher low).
Red Circle: Hidden weakness (Price higher high, Momentum lower high).
Platinum Thresholds (0.618): Solid thin lines representing the "Point of No Return." Once momentum clears these levels, it has escaped the "Gravity" of the mean and is in a high-velocity trend.
█ Intelligence Dashboard (HUD)
The top-right dashboard provides a real-time statistical breakdown:
Momentum: The raw numerical power of the current move.
Velocity: Displays ACCEL (Accelerating) or DECEL (Decelerating) to show if a trend is gaining or losing steam.
Heat Index: Automatically flags the market as STABLE or EXTREME (when momentum hits the 0.618 Fibonacci level).
Volatility: A measured squeeze metric.
COILING (Amber): Momentum is compressed in a tight range; an explosive breakout is imminent.
EXPANDING (Green): The market is currently in an explosive expansion phase.
Status: The final validated trend state (BULLISH / BEARISH / STABLE).
█ Trading Manual
1. The Early Entry (The Spark)
Watch for the Predictive Spark (✦) to appear while the price is still near the outer bands on your main chart. This signals that the "engine" has already turned around, even if the "car" (price) hasn't moved yet.
2. The Trend Confirmation (The Gate)
Enter a trend-following trade once the oscillator wave crosses the Solid Platinum 0.618 line. This confirms the move has institutional volume behind it and is likely to reach the Level 6 (1.618) target.
3. The Reversal Confluence (The Perfect Exit)
Look for a Divergence Circle (●) to appear at the same time the main chart hits a Level 6 Sparkle (✦). This represents maximum statistical exhaustion and is the highest-probability point for a reversal or profit-taking.
4. The Squeeze Play
When the Dashboard shows Volatility: COILING, do not enter new trend trades. Wait for the status to flip to EXPANDING and follow the direction of the next VWAP Star (★) on the main chart.
* This indicator is intended for educational and informational purposes only and should not be considered financial advice. Trading involves significant risk, and you should consult with a financial advisor before making any trading decisions. The performance of this indicator is not guaranteed, and past results do not predict future performance. Use at your own risk.
QuantFlow Strategic Trading System: Unified Manual
█ Integrating Institutional Value with Momentum Velocity
The QuantFlow Suite is designed to work as a synchronized dual-layer system.
Link to Quantflow: Precision Fibonacci VWAP: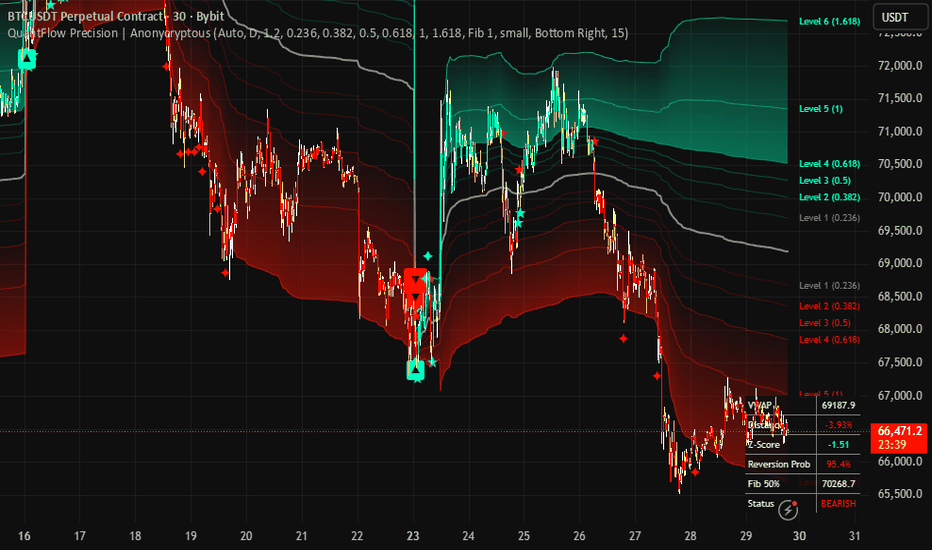
The Precision Fibonacci VWAP (Main Chart) defines the "Where" (Institutional Fair Value), while the Quantflow: Precision Momentum Oscillator (Sub-pane) defines the "When" (Velocity and Timing).
█ Phase 1: Identifying the Market Regime
Before entering any trade, use the Main Chart Candle Colors and the Oscillator Dashboard to determine the current regime:
Bullish Regime: Main Chart candles are Fluor Green. Oscillator is above the Midline.
Bearish Regime: Main Chart candles are Fluor Red. Oscillator is below the Midline.
Neutral/Coiling Regime: Main Chart candles are Grey. Oscillator Dashboard shows Volatility: COILING.
Strategy: In a Coiling regime, avoid new entries. The market is building energy for an explosive break. Wait for a VWAP Star (★) to signal the direction of the breakout.
█ Phase 2: The Three Strategic Setups
Setup 1: The "Institutional Launch" (Trend Following)
This setup captures the meat of a new trend just as it gains institutional speed.
Main Chart: Look for a Bullish/Bearish Star (★) as price reclaims or loses the VWAP line.
Oscillator: Ensure momentum is crossing the 0.618 Platinum Gate.
Confirmation: Main chart candles must flip to Fluor Green/Red.
Target: The Fibonacci Level 5 (1.0) or Level 6 (1.618) bands on the main chart.
Setup 2: The "Perfect Exhaustion" (Mean Reversion)
This setup identifies the exact mathematical top or bottom of a move.
Main Chart: Price pierces the Level 6 (1.618) Fibonacci Band, triggering a Sparkle (✦) marker.
Oscillator: A Divergence Circle (●) appears (Green for long, Red for short), showing that momentum is dying while price is at an extreme.
Dashboard Check: The Reversion Prob should be >99% on the main chart table.
Entry: Wait for the first candle to turn Grey (Loss of momentum) or a Predictive Spark (✦) to appear on the oscillator in the opposite direction.
Setup 3: The "Early Spark" (The Scalper’s Lead)
This setup is for aggressive traders looking to enter before the VWAP break.
Oscillator: A Predictive Spark (✦) appears while the main chart is still near an outer Fibonacci band.
Momentum Check: Look at the Velocity on the dashboard. It should flip from DECEL to ACCEL in your trade direction.
The Play: Anticipate the price returning to the VWAP (The Zero Line). If price breaks the VWAP, you can hold for a full trend reversal.
█ Phase 3: Risk Management & Trailing
The Stop-Loss: In a trend trade, your primary "Hard Stop" should be the VWAP Line itself. If price crosses back over the VWAP and triggers an opposite-colored Star (★), the institutional thesis is invalidated.
The Trailing Stop: Use the Fibonacci Level 1 or 2 bands (The Range boundaries) to trail your stop-loss as the trend develops.
Profit Taking: Always take partial profits when the Heat Index on the oscillator dashboard reaches EXTREME. This tells you the "easy money" part of the move is over.
█ The "QuantFlow" Golden Rule
Never trade against the "Double Signal":
If the Main Chart is Fluor Red but the Oscillator shows a Bullish Spark (✦), do not short. You are at a statistical bottom.
If the Main Chart is Fluor Green but the Oscillator shows a Bearish Divergence (●), do not go long. You are at a statistical top.
Wait for the confluence of both "Alpha" (Price) and "Flow" (Momentum) for the highest-probability results.
* This indicator is intended for educational and informational purposes only and should not be considered financial advice. Trading involves significant risk, and you should consult with a financial advisor before making any trading decisions. The performance of this indicator is not guaranteed, and past results do not predict future performance. Use at your own risk.
█ The Institutional Engine Room
The QuantFlow: Precision Momentum Oscillator is a professional-grade predictive engine designed to serve as the "Engine Room" for your trading chart. While the main chart shows where price is relative to value, this oscillator analyzes the velocity, quality, and exhaustion of momentum, providing signals that often precede price movement.
█ Technical Core
Zero-Lag DEMA Engine: Uses a Double Exponential Moving Average (DEMA) to eliminate the lag common in standard oscillators. This ensures that midline crosses and color flips happen in real-time with price action.
MIDAS Volume Integration: Calculations are rooted in the same cumulative volume-weighting as the QuantFlow: Precision Fibonacci VWAP, ensuring the oscillator is measuring "Smart Money" momentum rather than just retail price movement.
Adaptive Sensitivity: Defaulted to 3, specifically optimized for high-volatility 15m assets like Bitcoin, providing the fastest possible reaction time.
█ Visual Intelligence System
Momentum Wave & Gradient: A high-contrast wave that flips between Fluor Green (Bullish) and Fluor Red (Bearish). The gradient density shows the "depth" of the current momentum.
Early Warning Sparks (✦): These sparkles trigger when momentum velocity shifts before price reaches the zero-line. They are your "Get Ready" signals for an upcoming trend change.
Exhaustion Divergences (●): Tiny circles that appear on the wave to signal high-probability reversals.
Green Circle: Hidden strength (Price lower low, Momentum higher low).
Red Circle: Hidden weakness (Price higher high, Momentum lower high).
Platinum Thresholds (0.618): Solid thin lines representing the "Point of No Return." Once momentum clears these levels, it has escaped the "Gravity" of the mean and is in a high-velocity trend.
█ Intelligence Dashboard (HUD)
The top-right dashboard provides a real-time statistical breakdown:
Momentum: The raw numerical power of the current move.
Velocity: Displays ACCEL (Accelerating) or DECEL (Decelerating) to show if a trend is gaining or losing steam.
Heat Index: Automatically flags the market as STABLE or EXTREME (when momentum hits the 0.618 Fibonacci level).
Volatility: A measured squeeze metric.
COILING (Amber): Momentum is compressed in a tight range; an explosive breakout is imminent.
EXPANDING (Green): The market is currently in an explosive expansion phase.
Status: The final validated trend state (BULLISH / BEARISH / STABLE).
█ Trading Manual
1. The Early Entry (The Spark)
Watch for the Predictive Spark (✦) to appear while the price is still near the outer bands on your main chart. This signals that the "engine" has already turned around, even if the "car" (price) hasn't moved yet.
2. The Trend Confirmation (The Gate)
Enter a trend-following trade once the oscillator wave crosses the Solid Platinum 0.618 line. This confirms the move has institutional volume behind it and is likely to reach the Level 6 (1.618) target.
3. The Reversal Confluence (The Perfect Exit)
Look for a Divergence Circle (●) to appear at the same time the main chart hits a Level 6 Sparkle (✦). This represents maximum statistical exhaustion and is the highest-probability point for a reversal or profit-taking.
4. The Squeeze Play
When the Dashboard shows Volatility: COILING, do not enter new trend trades. Wait for the status to flip to EXPANDING and follow the direction of the next VWAP Star (★) on the main chart.
* This indicator is intended for educational and informational purposes only and should not be considered financial advice. Trading involves significant risk, and you should consult with a financial advisor before making any trading decisions. The performance of this indicator is not guaranteed, and past results do not predict future performance. Use at your own risk.
QuantFlow Strategic Trading System: Unified Manual
█ Integrating Institutional Value with Momentum Velocity
The QuantFlow Suite is designed to work as a synchronized dual-layer system.
Link to Quantflow: Precision Fibonacci VWAP:
The Precision Fibonacci VWAP (Main Chart) defines the "Where" (Institutional Fair Value), while the Quantflow: Precision Momentum Oscillator (Sub-pane) defines the "When" (Velocity and Timing).
█ Phase 1: Identifying the Market Regime
Before entering any trade, use the Main Chart Candle Colors and the Oscillator Dashboard to determine the current regime:
Bullish Regime: Main Chart candles are Fluor Green. Oscillator is above the Midline.
Bearish Regime: Main Chart candles are Fluor Red. Oscillator is below the Midline.
Neutral/Coiling Regime: Main Chart candles are Grey. Oscillator Dashboard shows Volatility: COILING.
Strategy: In a Coiling regime, avoid new entries. The market is building energy for an explosive break. Wait for a VWAP Star (★) to signal the direction of the breakout.
█ Phase 2: The Three Strategic Setups
Setup 1: The "Institutional Launch" (Trend Following)
This setup captures the meat of a new trend just as it gains institutional speed.
Main Chart: Look for a Bullish/Bearish Star (★) as price reclaims or loses the VWAP line.
Oscillator: Ensure momentum is crossing the 0.618 Platinum Gate.
Confirmation: Main chart candles must flip to Fluor Green/Red.
Target: The Fibonacci Level 5 (1.0) or Level 6 (1.618) bands on the main chart.
Setup 2: The "Perfect Exhaustion" (Mean Reversion)
This setup identifies the exact mathematical top or bottom of a move.
Main Chart: Price pierces the Level 6 (1.618) Fibonacci Band, triggering a Sparkle (✦) marker.
Oscillator: A Divergence Circle (●) appears (Green for long, Red for short), showing that momentum is dying while price is at an extreme.
Dashboard Check: The Reversion Prob should be >99% on the main chart table.
Entry: Wait for the first candle to turn Grey (Loss of momentum) or a Predictive Spark (✦) to appear on the oscillator in the opposite direction.
Setup 3: The "Early Spark" (The Scalper’s Lead)
This setup is for aggressive traders looking to enter before the VWAP break.
Oscillator: A Predictive Spark (✦) appears while the main chart is still near an outer Fibonacci band.
Momentum Check: Look at the Velocity on the dashboard. It should flip from DECEL to ACCEL in your trade direction.
The Play: Anticipate the price returning to the VWAP (The Zero Line). If price breaks the VWAP, you can hold for a full trend reversal.
█ Phase 3: Risk Management & Trailing
The Stop-Loss: In a trend trade, your primary "Hard Stop" should be the VWAP Line itself. If price crosses back over the VWAP and triggers an opposite-colored Star (★), the institutional thesis is invalidated.
The Trailing Stop: Use the Fibonacci Level 1 or 2 bands (The Range boundaries) to trail your stop-loss as the trend develops.
Profit Taking: Always take partial profits when the Heat Index on the oscillator dashboard reaches EXTREME. This tells you the "easy money" part of the move is over.
█ The "QuantFlow" Golden Rule
Never trade against the "Double Signal":
If the Main Chart is Fluor Red but the Oscillator shows a Bullish Spark (✦), do not short. You are at a statistical bottom.
If the Main Chart is Fluor Green but the Oscillator shows a Bearish Divergence (●), do not go long. You are at a statistical top.
Wait for the confluence of both "Alpha" (Price) and "Flow" (Momentum) for the highest-probability results.
* This indicator is intended for educational and informational purposes only and should not be considered financial advice. Trading involves significant risk, and you should consult with a financial advisor before making any trading decisions. The performance of this indicator is not guaranteed, and past results do not predict future performance. Use at your own risk.
Versionshinweise
█ Technical Upgrade: ALMAThe QuantFlow: Precision Momentum Oscillator has been upgraded with the Arnaud Legoux Moving Average (ALMA).
Unlike standard smoothing methods, ALMA uses a Gaussian (Bell Curve) distribution to eliminate the lag common in traditional indicators while providing a silkier, jitter-free wave. This institutional-grade engine ensures that trend flips and predictive signals occur with zero delay, perfectly syncing momentum with real-time price action on high-volatility assets.
Versionshinweise
Chart update!Versionshinweise
How to use:█ Momentum Velocity, Exhaustion & Lead Analysis
The QuantFlow Momentum Oscillator is your "Predictive Engine." It uses a Zero-Lag ALMA calculation to show you the internal speed of the market, allowing you to anticipate trend changes before they are confirmed on the price chart.
█ Lower Timeframe Strategy (1m – 15m)
Scalping, Timing, and Early Warnings
The Predictive Lead (✦): On the 1m–5m charts, look for the Early Warning Spark (✦). This signals a shift in momentum velocity while price is still at an extreme. It often precedes the actual VWAP break by 1-3 candles.
Velocity HUD Check: Monitor the Velocity cell on the dashboard.
ACCEL: Momentum is building—stay with the trade.
DECEL: Momentum is dying—prepare to exit or tighten stops, even if the wave is still Green/Red.
The "Coiling" Squeeze: If the dashboard shows Volatility: COILING (Amber), the market is building energy. Do not scalp in this zone. Wait for the status to flip to EXPANDING and follow the next Spark (✦) direction.
█ Higher Timeframe Strategy (1H – Daily)
Trend Quality and Macro Reversals
The 0.618 Platinum Gate: On HTF, the solid platinum lines are your "Gate." If the oscillator wave is Above +0.618, the macro trend is officially "Supercharged." This is where you look for long-term trend-following continuations.
Institutional Exhaustion (●): The Divergence Circles (●) are most powerful on HTF.
Red Circle (●) at Highs: Price is hitting new highs, but institutional momentum is failing. This is a massive warning of a macro trend reversal.
Green Circle (●) at Lows: Price is crashing, but momentum is "bottoming out." This signals a major recovery is being built.
Heat Index Monitoring: If the dashboard shows Heat Index: EXTREME, the macro move is statistically overextended. This is your cue to take profits on swing positions.
█ Dashboard HUD: Momentum Intelligence
Mom. Power: Shows the exact numerical "Weight" of the current move.
Status: A three-state trend validator (BULLISH / BEARISH / STABLE). If the status is STABLE (Grey), the market lacks institutional direction.
Volatility: Measures the "Squeeze" effect. COILING markets always lead to high-velocity EXPANDING moves.
█ The "Perfect Confluence" (Using the Quantflow: Precision Fibonacci VWAP and Quantflow: Precision Momentum Oscillator together)
The Entry: A Bullish Spark (✦) appears on the Oscillator + Main Chart shows a Green Star (★).
The Exit: Price pierces a Level 6 Fibonacci Band (VWAP Fib) + A Bearish Divergence (●) appears on the Oscillator + Heat Index is EXTREME.
Summary:
LTF: Follow the Predictive Sparks (✦) and Velocity status for precision timing.
HTF: Use the 0.618 Gate and Divergence Circles (●) to ride major institutional trends.
Open-source Skript
Ganz im Sinne von TradingView hat dieser Autor sein/ihr Script als Open-Source veröffentlicht. Auf diese Weise können nun auch andere Trader das Script rezensieren und die Funktionalität überprüfen. Vielen Dank an den Autor! Sie können das Script kostenlos verwenden, aber eine Wiederveröffentlichung des Codes unterliegt unseren Hausregeln.

Haftungsausschluss
Die Informationen und Veröffentlichungen sind nicht als Finanz-, Anlage-, Handels- oder andere Arten von Ratschlägen oder Empfehlungen gedacht, die von TradingView bereitgestellt oder gebilligt werden, und stellen diese nicht dar. Lesen Sie mehr in den Nutzungsbedingungen.
Open-source Skript
Ganz im Sinne von TradingView hat dieser Autor sein/ihr Script als Open-Source veröffentlicht. Auf diese Weise können nun auch andere Trader das Script rezensieren und die Funktionalität überprüfen. Vielen Dank an den Autor! Sie können das Script kostenlos verwenden, aber eine Wiederveröffentlichung des Codes unterliegt unseren Hausregeln.
Haftungsausschluss
Die Informationen und Veröffentlichungen sind nicht als Finanz-, Anlage-, Handels- oder andere Arten von Ratschlägen oder Empfehlungen gedacht, die von TradingView bereitgestellt oder gebilligt werden, und stellen diese nicht dar. Lesen Sie mehr in den Nutzungsbedingungen.