TMS CCI is based on Commodity Channel Index
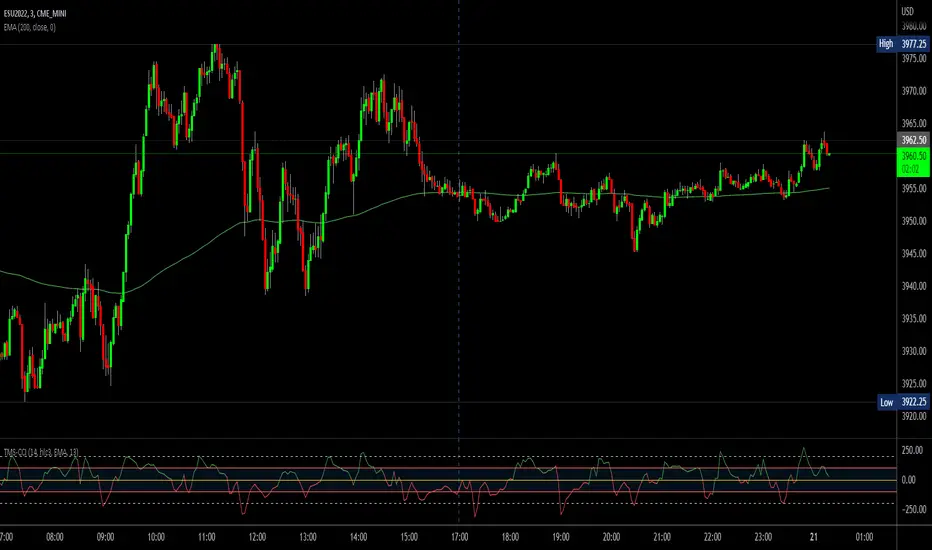
This indicator is based on CCI, but draws the CCI link green/red. If CCI line is above zero, then it is painted green. If CCI is lower than zero, then it is painted red.
How to trade:
Buy Side
1. When CCI crosses above zeroline from under, it is a bullish signal, Wait for the candle to close and place an order at the closing price. Exit when CCI crosses below zeroline.
Sell Side
2. When CCI crosses below zeroline from above, it is a bearish signal, Wait for the candle to close and place an order at the closing price. Exit when CCI crosses above zeroline.
How to trade:
Buy Side
1. When CCI crosses above zeroline from under, it is a bullish signal, Wait for the candle to close and place an order at the closing price. Exit when CCI crosses below zeroline.
Sell Side
2. When CCI crosses below zeroline from above, it is a bearish signal, Wait for the candle to close and place an order at the closing price. Exit when CCI crosses above zeroline.

Haftungsausschluss
Die Informationen und Veröffentlichungen sind nicht als Finanz-, Anlage-, Handels- oder andere Arten von Ratschlägen oder Empfehlungen gedacht, die von TradingView bereitgestellt oder gebilligt werden, und stellen diese nicht dar. Lesen Sie mehr in den Nutzungsbedingungen.
Haftungsausschluss
Die Informationen und Veröffentlichungen sind nicht als Finanz-, Anlage-, Handels- oder andere Arten von Ratschlägen oder Empfehlungen gedacht, die von TradingView bereitgestellt oder gebilligt werden, und stellen diese nicht dar. Lesen Sie mehr in den Nutzungsbedingungen.