FVG Map [JOAT]
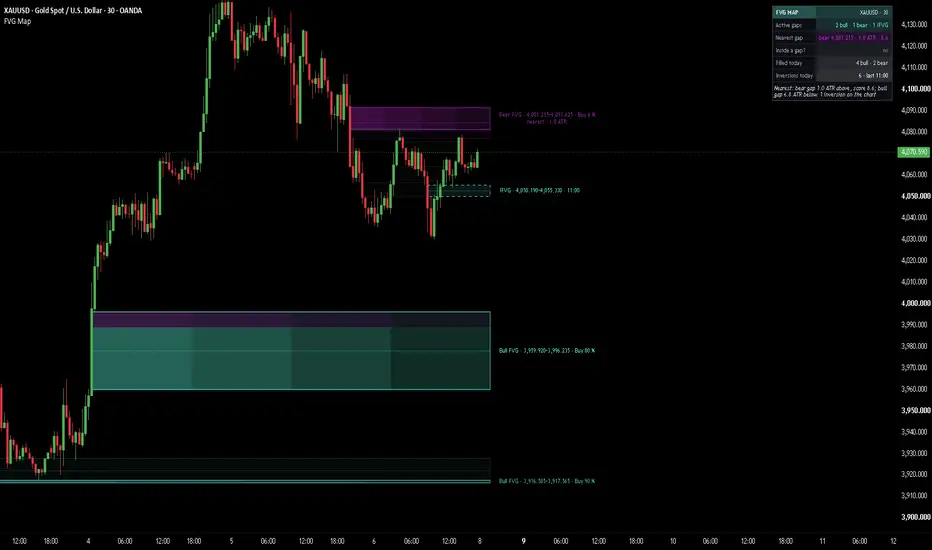
FVG Map is an open-source fair value gap map. Every gap on the chart is drawn with the buying and selling inside it split at the exact price, its consequent encroachment line, how much of it has been filled and whether it inverted. The gaps that matter stay bright; the rest fade, turn grey or leave.
A fair value gap is the price range a fast candle leaves untraded: the space between the high of the candle before it and the low of the candle after it (or the reverse for a move down). Many ICT and SMC traders mark these gaps and watch what price does when it comes back to them. This indicator does the marking and the bookkeeping and leaves the reading to you. It draws no buy or sell signals, no entries and no targets: gaps, their fill state and data only.

Core Concepts
1. The gap and its score
A bull gap forms when the third candle's low stays above the first candle's high; a bear gap when the third candle's high stays below the first candle's low. Gaps are read on confirmed candles only and must be at least the minimum size in ATR. Each gap gets a score out of 10:
Pine Script®
Gap size in ATR counts 35 % (a 1 ATR gap gets full marks), the drive of the middle candle 30 % (its range in ATR and how much of it is body), the middle candle's volume rank 20 %, and the close tilt toward the gap's side 15 %. On symbols without volume the first two parts are rescaled to 10. With "Best gaps only" on, only gaps at or above the score you set are drawn, and each side keeps at most four live gaps by default, so a 1-minute chart never turns into a wall of boxes.
2. The bought and sold split
Each candle's volume is counted as bought by where it closed in its range (a close at the high counts all of it as bought, a close at the middle half of it). The bought share of the three candles splits the box in two: the bought part at the bottom in the bull colour, the sold part at the top in the bear colour. The share that matches the gap's side is drawn a little stronger. Both parts are nested gradients, strongest where the gap was born and fading toward the right edge. The tag reads "Buy 63 %".
3. CE, partial fill and full fill
A dotted line marks the consequent encroachment, the middle of the original gap. When price trades into a gap the box shrinks from the touched edge, the part already filled stays as a faint dotted ghost, and the CE line dims once the fill reaches it. When a wick reaches the far side the gap is filled: the box turns grey, stops at the filling candle and loses its text, and only the last few grey gaps are kept, so history does not litter the chart.
4. Inversion (IFVG)
When a candle closes through the far side of a gap, the gap inverts. The box is restyled as a dashed outline in the other side's colour (an inverted bull gap is drawn in the bear colour, and the reverse) and tagged "IFVG" with its range and the time of the inversion. Only the newest few inversions are kept. A gap that was filled by a wick can still invert if a close goes through its far side within a short window. An inversion ends, and turns grey, when a candle closes back through its other side. An inversion is a change of structure state, not an entry.
5. Higher-timeframe gaps (optional)
Turn on "Show higher-timeframe gaps" to add gaps from up to two higher timeframes (15 minutes and 1 hour by default). They are drawn as thick outlines with a dotted CE and a tag such as "1H FVG · 26,912.50–26,940.25", shrink as chart candles fill them, and leave when fully filled. Each timeframe costs one request, read one closed bar back, so a higher-timeframe gap appears only after its third candle has closed and never changes afterwards.

Features
Input Parameters
Gaps:
Fill and inversion:
Gap look:
Tags:
Higher-timeframe gaps:
Theme:
Dashboard:
Candles:
How to Use This Indicator
Reading a gap
The colour of the frame and the tag tells you the side: bull gaps sit under price, bear gaps over it. The tag gives the range that is still open and the bought share of the three candles that made it. Hover the tag for the score, the size in ATR and points, the fill %, whether the CE has been reached, and the age.
Reading the fill
A gap that has not been touched is drawn bright with a solid frame. Once price trades into it, the box shrinks from the touched edge and dims, and the ghost shows how far the fill went. A fill that stops before the CE leaves more than half of the gap open; a fill past the CE dims the CE line. A grey box is a gap that has been filled completely.
Reading an inversion
A dashed outline tagged "IFVG" is a gap price closed through. Its colour is the side it now sits on: an inverted bull gap above price is drawn in the bear colour. Many FVG readers watch how price behaves when it comes back to an inverted gap; the indicator shows where they are and when they inverted, and leaves the judgement to you.
Reading the dashboard
Active gaps counts the live gaps per side. Nearest gap gives the near edge, the distance in ATR and the score, and the same distance is written on that gap's tag. Inside a gap tells you whether the close is in a gap and how much of it is filled. Filled today and Inversions today count what happened since the day started. The Read line puts it in one sentence.
Keeping the chart clean
The defaults keep four live gaps per side with a score of at least 5, three faint grey gaps and three inversions, which keeps a 1-minute chart readable. On 1H and above raise "Max live gaps per side" or lower the score. Turn off "Best gaps only" to see every gap above the minimum size.
Indicator Limitations
Originality Statement
Disclaimer
This indicator is provided for educational and informational purposes only. It is not financial advice and it does not tell you when to buy or sell. Trading involves substantial risk of loss. Fair value gaps, fills and inversions describe past price behaviour, not future price behaviour. The author accepts no responsibility for trading losses resulting from use of this indicator.
Made with passion by jackofalltrades
A fair value gap is the price range a fast candle leaves untraded: the space between the high of the candle before it and the low of the candle after it (or the reverse for a move down). Many ICT and SMC traders mark these gaps and watch what price does when it comes back to them. This indicator does the marking and the bookkeeping and leaves the reading to you. It draws no buy or sell signals, no entries and no targets: gaps, their fill state and data only.
Core Concepts
1. The gap and its score
A bull gap forms when the third candle's low stays above the first candle's high; a bear gap when the third candle's high stays below the first candle's low. Gaps are read on confirmed candles only and must be at least the minimum size in ATR. Each gap gets a score out of 10:
Gap size in ATR counts 35 % (a 1 ATR gap gets full marks), the drive of the middle candle 30 % (its range in ATR and how much of it is body), the middle candle's volume rank 20 %, and the close tilt toward the gap's side 15 %. On symbols without volume the first two parts are rescaled to 10. With "Best gaps only" on, only gaps at or above the score you set are drawn, and each side keeps at most four live gaps by default, so a 1-minute chart never turns into a wall of boxes.
2. The bought and sold split
Each candle's volume is counted as bought by where it closed in its range (a close at the high counts all of it as bought, a close at the middle half of it). The bought share of the three candles splits the box in two: the bought part at the bottom in the bull colour, the sold part at the top in the bear colour. The share that matches the gap's side is drawn a little stronger. Both parts are nested gradients, strongest where the gap was born and fading toward the right edge. The tag reads "Buy 63 %".
3. CE, partial fill and full fill
A dotted line marks the consequent encroachment, the middle of the original gap. When price trades into a gap the box shrinks from the touched edge, the part already filled stays as a faint dotted ghost, and the CE line dims once the fill reaches it. When a wick reaches the far side the gap is filled: the box turns grey, stops at the filling candle and loses its text, and only the last few grey gaps are kept, so history does not litter the chart.
4. Inversion (IFVG)
When a candle closes through the far side of a gap, the gap inverts. The box is restyled as a dashed outline in the other side's colour (an inverted bull gap is drawn in the bear colour, and the reverse) and tagged "IFVG" with its range and the time of the inversion. Only the newest few inversions are kept. A gap that was filled by a wick can still invert if a close goes through its far side within a short window. An inversion ends, and turns grey, when a candle closes back through its other side. An inversion is a change of structure state, not an entry.
5. Higher-timeframe gaps (optional)
Turn on "Show higher-timeframe gaps" to add gaps from up to two higher timeframes (15 minutes and 1 hour by default). They are drawn as thick outlines with a dotted CE and a tag such as "1H FVG · 26,912.50–26,940.25", shrink as chart candles fill them, and leave when fully filled. Each timeframe costs one request, read one closed bar back, so a higher-timeframe gap appears only after its third candle has closed and never changes afterwards.
Features
- Two-tone gap boxes: Bought share at the bottom, sold share at the top, split at the exact price, each a nested gradient that fades away from the origin
- Short tags at the right end: "Bull FVG · 26,912.50–26,940.25 · Buy 63 %"; score, size in ATR, fill %, CE state and age in the tooltip
- Distance on the nearest gap: The nearest live gap carries a second line, "nearest · 0.8 ATR" or "price inside · 40 % filled"
- CE line: Dotted line at the middle of the original gap, dimmed once a fill reaches it
- Partial fill shrink: The box is eaten from the touched edge, the filled part stays as a ghost
- Full fill to grey: Filled gaps turn grey and lose their text; only the last few are kept
- Inversion lifecycle: Close through the far side gives a dashed IFVG outline in the other side's colour with its time; a close back through ends it
- Best gaps only: Score filter and a cap on live gaps per side keep low timeframes clean
- Optional higher-timeframe layer: Two timeframes, thick outlines, "1H FVG" tags, non-repainting
- Glow on the strongest gaps: A soft halo around gaps with a high score
- Dashboard: Active gaps, nearest gap, inside a gap, filled today, inversions today and a Read line, every row with a tooltip
- Candle paint (optional): Candles inside a gap take its colour, between gaps they blend by position
- Six themes plus Custom: Including Paper & Ink, a clean black and white preset for white charts where direction is carried by line style, and automatic light / dark chart detection
- Free-account safe: No request calls by default, drawings capped and retired oldest first, nothing anchored beyond 5,000 bars
- Alerts: New bull FVG, New bear FVG, Price entered a gap, Gap filled, Gap inverted (IFVG)
Input Parameters
Gaps:
- Min gap size (ATR) (default: 0.25)
- Best gaps only, score at least (default: on, 5.0)
- Max live gaps per side (default: 4)
- Gap age-out (bars) (default: 1500)
- Volume rank length (default: 50)
- Extend right (bars) (default: 4)
Fill and inversion:
- Filled part as a ghost (default: on)
- Grey history of filled gaps, keep (default: on, 3)
- Inversions (IFVG), keep (default: on, 3)
- Inversion window after a full fill (bars) (default: 10)
Gap look:
- Gradient steps (default: 4)
- Fill at the origin (transparency) (default: 66)
- CE line (50 %) (default: on)
- Glow when score is at least (default: 7.0), Glow layers (default: 2)
Tags:
- Gap tags and their size (default: on, Small)
- Tag: price range, Tag: bought share, Tag: distance on the nearest gap (default: on)
- Label lane gap (ATR) (default: 0.6)
Higher-timeframe gaps:
- Show higher-timeframe gaps (default: off)
- Timeframe 1 (default: on, 15 minutes), Timeframe 2 (default: on, 1 hour)
- Gaps per side per timeframe (default: 2)
Theme:
- Theme: JOAT Signature, Midnight Blue / Red, Aurora Night, Delta Cyan / Pink, Paper & Ink, Lime Ember, Custom (default: JOAT Signature)
- Brightness 1-5 (default: 3)
- Chart background: Auto, Dark, Light (default: Auto)
- Custom colours: bull, bear, accent, neutral, text, panel, glow
Dashboard:
- Show dashboard, Dashboard position, Dashboard size (Small, Normal, Large), Compact dashboard, Tinted value cells
Candles:
- Candle paint: Off, Score, Mono (default: Off)
How to Use This Indicator
Reading a gap
The colour of the frame and the tag tells you the side: bull gaps sit under price, bear gaps over it. The tag gives the range that is still open and the bought share of the three candles that made it. Hover the tag for the score, the size in ATR and points, the fill %, whether the CE has been reached, and the age.
Reading the fill
A gap that has not been touched is drawn bright with a solid frame. Once price trades into it, the box shrinks from the touched edge and dims, and the ghost shows how far the fill went. A fill that stops before the CE leaves more than half of the gap open; a fill past the CE dims the CE line. A grey box is a gap that has been filled completely.
Reading an inversion
A dashed outline tagged "IFVG" is a gap price closed through. Its colour is the side it now sits on: an inverted bull gap above price is drawn in the bear colour. Many FVG readers watch how price behaves when it comes back to an inverted gap; the indicator shows where they are and when they inverted, and leaves the judgement to you.
Reading the dashboard
Active gaps counts the live gaps per side. Nearest gap gives the near edge, the distance in ATR and the score, and the same distance is written on that gap's tag. Inside a gap tells you whether the close is in a gap and how much of it is filled. Filled today and Inversions today count what happened since the day started. The Read line puts it in one sentence.
Keeping the chart clean
The defaults keep four live gaps per side with a score of at least 5, three faint grey gaps and three inversions, which keeps a 1-minute chart readable. On 1H and above raise "Max live gaps per side" or lower the score. Turn off "Best gaps only" to see every gap above the minimum size.
Indicator Limitations
- A gap is only known when its third candle closes, so it appears one candle after the move that made it. Fills and inversions are also decided on closed candles, which is what keeps them from repainting
- ATR, volume rank and every distance are measured on the chart timeframe; the same gap can score differently on another timeframe
- The bought / sold split is estimated from where each candle closed in its range, not from tick, footprint or order book data, and it needs a symbol with volume. Without volume the box is drawn in the gap's own colour and the score uses size and drive only
- Higher-timeframe gaps are read one closed bar back, so they appear after the higher-timeframe candle closes; a timeframe at or below the chart's is skipped
- "Today" follows the exchange's daily session of the symbol
- A free TradingView account loads about 5,000 bars, so the oldest gaps and the counts only cover that history
- Label spacing works in price units, not screen pixels; at extreme zoom levels raise the label lane gap. With the dashboard Top Right, tags in the band it covers lose their text (the nearest gap's tag is always kept)
Originality Statement
- This is not a re-post of the Delta Imbalance Map [JOAT]. That script draws imbalance zones with a buy / sell split and a mitigation switch. FVG Map adds what it does not have: a CE line, a partial fill that shrinks the box from the touched edge with a ghost of the filled part, a full-fill-to-grey history that drops its text, an inversion lifecycle (dashed IFVG outline in the other side's colour, inversion time, a late inversion after a wick fill, an end when price closes back through), an optional non-repainting higher-timeframe layer, and a Paper & Ink black and white mode for white charts
- The split, the gradient and the lifecycle are one object: a gap's age, side, buying and selling, fill and state can be read without opening a tooltip, and its two shares are nested gradients that fade away from the origin
- The dashboard is tied to the drawings: the nearest gap, its distance and its fill are written on that gap's tag, and every right-edge tag goes through one lane pass so tags do not overlap
Disclaimer
This indicator is provided for educational and informational purposes only. It is not financial advice and it does not tell you when to buy or sell. Trading involves substantial risk of loss. Fair value gaps, fills and inversions describe past price behaviour, not future price behaviour. The author accepts no responsibility for trading losses resulting from use of this indicator.
Made with passion by jackofalltrades

The Proven Highest Win Rate Trading Indicators, Strategies, Tools, + Signals !! 🃏
Get Access and See Full Results👇
jackofalltrades.vip 🌐
Get Access and See Full Results👇
jackofalltrades.vip 🌐
Haftungsausschluss
Die Informationen und Veröffentlichungen sind nicht als Finanz-, Anlage-, Handels- oder andere Arten von Ratschlägen oder Empfehlungen gedacht, die von TradingView bereitgestellt oder gebilligt werden, und stellen diese nicht dar. Lesen Sie mehr in den Nutzungsbedingungen.
The Proven Highest Win Rate Trading Indicators, Strategies, Tools, + Signals !! 🃏
Get Access and See Full Results👇
jackofalltrades.vip 🌐
Get Access and See Full Results👇
jackofalltrades.vip 🌐
Haftungsausschluss
Die Informationen und Veröffentlichungen sind nicht als Finanz-, Anlage-, Handels- oder andere Arten von Ratschlägen oder Empfehlungen gedacht, die von TradingView bereitgestellt oder gebilligt werden, und stellen diese nicht dar. Lesen Sie mehr in den Nutzungsbedingungen.