Aktualisiert
Long or Short? Trend Signals with Stop, Target & Size
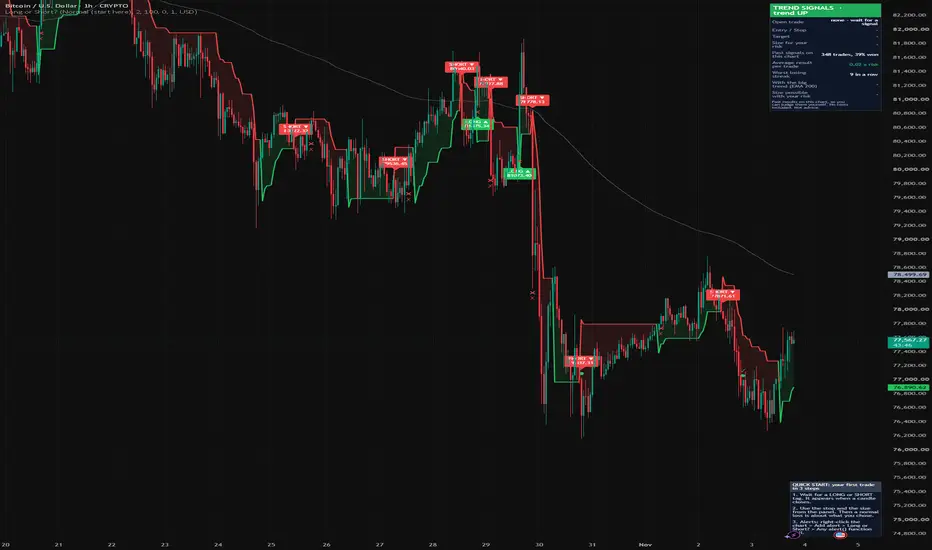
Do you know your entry, stop, target and size before you click? This script gives you all four: where to get in, where to get out if wrong, where to take profit, how much to trade.
Why it helps you.
- You get a full plan for every signal. The size fits the money you want to risk.
- You see the honest record of past signals on your own chart, losses included.
- You know your risk before you enter. So a loss is a planned cost, not a shock.
This script shows when a new trend starts. It also gives you a simple plan for each trade. It does the risk math for you.
What you see.
- A trend line with a soft cloud. It is green when the price goes up. It is red when the price goes down.
- LONG and SHORT tags. LONG means the trend turned up. SHORT means the trend turned down.
- A tag shows up only after a candle has closed. A candle is one bar on the chart. A closed candle will not change any more. So a tag does not appear and then disappear.
- On the newest candle, the trend line and the EMA line (an average of recent prices) can still move until that candle closes.
- Three lines for the open trade. Entry is the price where you get in. Stop is the price where you get out if you are wrong, so the loss stays small. Target is the price where you take the profit.
- The size: how much to buy or sell. With this size, a normal hit stop costs about the money you chose to risk.
- Marks where past trades ended, with a win or a loss.
- A panel with the honest record of past signals on this chart. It shows the number of trades and the share that won. It shows the average result per trade, counted in risks: 1 means you won as much as you risked.
- The panel also shows the worst losing streak. That is the most losses in a row.
- Sometimes the trend line turns, but the EMA 200 filter skips the new signal. Then your old trade stays open. The panel says so next to the open trade.
- A check for the open trade. Does it go with the big trend? Is your risk big enough for at least one contract or lot? A lot is a fixed amount on forex: 1 lot = 100,000 units.
- A quick start box with three steps. You can turn it off in the settings. You can also color the candles.
- Alerts that send you the whole plan.
How to use.
1. Add the script to a chart.
2. Pick a sensitivity: Calm, Normal or Fast.
3. Type the money you want to risk on one trade.
4. Wait for a LONG or SHORT tag on a closed candle.
5. Read the plan: entry, stop, target and size.
6. Look at the panel. It shows how the signals did on this market before.
7. For alerts, right-click the chart and choose Add alert. Pick "Long or Short?" and then "Any alert() function call". Here is an example of the alert text: "Trend Signals: LONG ES1! | entry 5012.25 | stop 4998.00 | target 5040.75 | size 2". These numbers are only an example.
8. Want a clean chart? Point at the script name on the chart, open the "More" menu and pick "Move tables to bottom". The panel and the quick start box then move under the chart.
How it works, in simple words.
- The trend line is TradingView's SuperTrend: a line that follows the price and keeps a gap from it. The gap is measured in ATR. ATR is the average size of recent candles.
- Calm uses ATR 14 and a gap of 3 ATR. Normal uses ATR 10 and a gap of 2 ATR. Fast uses ATR 7 and a gap of 1.5 ATR.
- Fast gives more signals. It also gives more wrong ones.
- LONG: the SuperTrend turns up on a closed candle. SHORT: it turns down on a closed candle.
- The EMA 200 is the average price of the last 200 candles. It shows the big trend.
- The trend filter is on by default. Then a LONG also needs the close above the EMA 200. A SHORT needs the close below it.
- Entry = the close of the signal candle. Stop = the SuperTrend line.
- Target = entry plus your reward:risk times the distance to the stop. For a SHORT it is minus. Reward:risk is how much you aim to win for each $1 you risk.
- Example: reward:risk is 2 and the stop is 10 points away. Then the target is 20 points away.
- Size = money to risk / (distance to stop x point value x lot size).
- The size is rounded down. Futures: whole contracts. Forex: steps of 0.01 lots. Crypto: steps of 0.001 coins.
- Crypto prices in USDT, USDC, FDUSD, BUSD, DAI, TUSD, USDP or USD1 count as US dollars on a US dollar account.
- For other prices, like ETHBTC, the script asks TradingView for the exchange rate. If the rate is missing, the last line of the panel says so. Then the size uses a rate of 1.
- The record counts one trade at a time. A trade ends at its stop, at its target or at the next opposite signal.
- Sometimes the stop and the target are both inside one candle. Then the script counts the stop. That is the worse case.
What is different.
Many free scripts show arrows and targets. This one also tells you how much to trade for the money you want to risk. It shows its own losses and its worst losing streak on your chart. So you can see how the signals really did on your market before you use them.
Limits.
- The record is the past on one chart. It does not include spread, slippage or commission. These are small costs of every trade. It is not a forecast.
- Trend signals lose when the price moves sideways. Losing streaks are normal.
- A stop does not always fill at your price. If the price jumps past your stop (a gap), the loss can be bigger than you planned.
- This is not financial advice and not a recommendation to trade. Test on a demo account first.
Why you can still trust it. The record counts every past signal on your chart, wins and losses, with the worst losing streak. You can check it yourself before you use a single signal.
Make it a habit. Before you take a signal, read the plan and the size in the panel.
Open source (MPL 2.0). Not affiliated with any broker or prop firm.
Why it helps you.
- You get a full plan for every signal. The size fits the money you want to risk.
- You see the honest record of past signals on your own chart, losses included.
- You know your risk before you enter. So a loss is a planned cost, not a shock.
This script shows when a new trend starts. It also gives you a simple plan for each trade. It does the risk math for you.
What you see.
- A trend line with a soft cloud. It is green when the price goes up. It is red when the price goes down.
- LONG and SHORT tags. LONG means the trend turned up. SHORT means the trend turned down.
- A tag shows up only after a candle has closed. A candle is one bar on the chart. A closed candle will not change any more. So a tag does not appear and then disappear.
- On the newest candle, the trend line and the EMA line (an average of recent prices) can still move until that candle closes.
- Three lines for the open trade. Entry is the price where you get in. Stop is the price where you get out if you are wrong, so the loss stays small. Target is the price where you take the profit.
- The size: how much to buy or sell. With this size, a normal hit stop costs about the money you chose to risk.
- Marks where past trades ended, with a win or a loss.
- A panel with the honest record of past signals on this chart. It shows the number of trades and the share that won. It shows the average result per trade, counted in risks: 1 means you won as much as you risked.
- The panel also shows the worst losing streak. That is the most losses in a row.
- Sometimes the trend line turns, but the EMA 200 filter skips the new signal. Then your old trade stays open. The panel says so next to the open trade.
- A check for the open trade. Does it go with the big trend? Is your risk big enough for at least one contract or lot? A lot is a fixed amount on forex: 1 lot = 100,000 units.
- A quick start box with three steps. You can turn it off in the settings. You can also color the candles.
- Alerts that send you the whole plan.
How to use.
1. Add the script to a chart.
2. Pick a sensitivity: Calm, Normal or Fast.
3. Type the money you want to risk on one trade.
4. Wait for a LONG or SHORT tag on a closed candle.
5. Read the plan: entry, stop, target and size.
6. Look at the panel. It shows how the signals did on this market before.
7. For alerts, right-click the chart and choose Add alert. Pick "Long or Short?" and then "Any alert() function call". Here is an example of the alert text: "Trend Signals: LONG ES1! | entry 5012.25 | stop 4998.00 | target 5040.75 | size 2". These numbers are only an example.
8. Want a clean chart? Point at the script name on the chart, open the "More" menu and pick "Move tables to bottom". The panel and the quick start box then move under the chart.
How it works, in simple words.
- The trend line is TradingView's SuperTrend: a line that follows the price and keeps a gap from it. The gap is measured in ATR. ATR is the average size of recent candles.
- Calm uses ATR 14 and a gap of 3 ATR. Normal uses ATR 10 and a gap of 2 ATR. Fast uses ATR 7 and a gap of 1.5 ATR.
- Fast gives more signals. It also gives more wrong ones.
- LONG: the SuperTrend turns up on a closed candle. SHORT: it turns down on a closed candle.
- The EMA 200 is the average price of the last 200 candles. It shows the big trend.
- The trend filter is on by default. Then a LONG also needs the close above the EMA 200. A SHORT needs the close below it.
- Entry = the close of the signal candle. Stop = the SuperTrend line.
- Target = entry plus your reward:risk times the distance to the stop. For a SHORT it is minus. Reward:risk is how much you aim to win for each $1 you risk.
- Example: reward:risk is 2 and the stop is 10 points away. Then the target is 20 points away.
- Size = money to risk / (distance to stop x point value x lot size).
- The size is rounded down. Futures: whole contracts. Forex: steps of 0.01 lots. Crypto: steps of 0.001 coins.
- Crypto prices in USDT, USDC, FDUSD, BUSD, DAI, TUSD, USDP or USD1 count as US dollars on a US dollar account.
- For other prices, like ETHBTC, the script asks TradingView for the exchange rate. If the rate is missing, the last line of the panel says so. Then the size uses a rate of 1.
- The record counts one trade at a time. A trade ends at its stop, at its target or at the next opposite signal.
- Sometimes the stop and the target are both inside one candle. Then the script counts the stop. That is the worse case.
What is different.
Many free scripts show arrows and targets. This one also tells you how much to trade for the money you want to risk. It shows its own losses and its worst losing streak on your chart. So you can see how the signals really did on your market before you use them.
Limits.
- The record is the past on one chart. It does not include spread, slippage or commission. These are small costs of every trade. It is not a forecast.
- Trend signals lose when the price moves sideways. Losing streaks are normal.
- A stop does not always fill at your price. If the price jumps past your stop (a gap), the loss can be bigger than you planned.
- This is not financial advice and not a recommendation to trade. Test on a demo account first.
Why you can still trust it. The record counts every past signal on your chart, wins and losses, with the worst losing streak. You can check it yourself before you use a single signal.
Make it a habit. Before you take a signal, read the plan and the size in the panel.
Open source (MPL 2.0). Not affiliated with any broker or prop firm.
Versionshinweise
Do you know your entry, stop, target and size before you click? This script gives you all four: where to get in, where to get out if wrong, where to take profit, how much to trade.Why it helps you.
- You get a full plan for every signal. The size fits the money you want to risk.
- You see the honest record of past signals on your own chart, losses included.
- You know your risk before you enter. So a loss is a planned cost, not a shock.
This script shows when a new trend starts. It also gives you a simple plan for each trade. It does the risk math for you.
What you see.
- A trend line with a soft cloud. It is green when the price goes up. It is red when the price goes down.
- LONG and SHORT tags. LONG means the trend turned up. SHORT means the trend turned down.
- A tag shows up only after a candle has closed. A candle is one bar on the chart. A closed candle will not change any more. So a tag does not appear and then disappear.
- On the newest candle, the trend line and the EMA line (an average of recent prices) can still move until that candle closes.
- Three lines for the open trade. Entry is the price where you get in. Stop is the price where you get out if you are wrong, so the loss stays small. Target is the price where you take the profit.
- The size: how much to buy or sell. With this size, a normal hit stop costs about the money you chose to risk.
- Marks where past trades ended, with a win or a loss.
- A panel with the honest record of past signals on this chart. It shows the number of trades and the share that won. It shows the average result per trade, counted in risks: 1 means you won as much as you risked.
- The panel also shows the worst losing streak. That is the most losses in a row.
- Sometimes the trend line turns, but the EMA 200 filter skips the new signal. Then your old trade stays open. The panel says so next to the open trade.
- A check for the open trade. Does it go with the big trend? Is your risk big enough for at least one contract or lot? A lot is a fixed amount on forex: 1 lot = 100,000 units.
- A quick start box with three steps. You can turn it off in the settings. You can also color the candles.
- Alerts that send you the whole plan.
How to use.
1. Add the script to a chart.
2. Pick a sensitivity: Calm, Normal or Fast.
3. Type the money you want to risk on one trade.
4. Wait for a LONG or SHORT tag on a closed candle.
5. Read the plan: entry, stop, target and size.
6. Look at the panel. It shows how the signals did on this market before.
7. For alerts, right-click the chart and choose Add alert. Pick "Long or Short?" and then "Any alert() function call". Here is an example of the alert text: "Trend Signals: LONG ES1! | entry 5012.25 | stop 4998.00 | target 5040.75 | size 2". These numbers are only an example.
8. Want a clean chart? Point at the script name on the chart, open the "More" menu and pick "Move tables to bottom". The panel and the quick start box then move under the chart.
How it works, in simple words.
- The trend line is TradingView's SuperTrend: a line that follows the price and keeps a gap from it. The gap is measured in ATR. ATR is the average size of recent candles.
- Calm uses ATR 14 and a gap of 3 ATR. Normal uses ATR 10 and a gap of 2 ATR. Fast uses ATR 7 and a gap of 1.5 ATR.
- Fast gives more signals. It also gives more wrong ones.
- LONG: the SuperTrend turns up on a closed candle. SHORT: it turns down on a closed candle.
- The EMA 200 is the average price of the last 200 candles. It shows the big trend.
- The trend filter is on by default. Then a LONG also needs the close above the EMA 200. A SHORT needs the close below it.
- Entry = the close of the signal candle. Stop = the SuperTrend line.
- Target = entry plus your reward:risk times the distance to the stop. For a SHORT it is minus. Reward:risk is how much you aim to win for each $1 you risk.
- Example: reward:risk is 2 and the stop is 10 points away. Then the target is 20 points away.
- Size = money to risk / (distance to stop x point value x lot size).
- The size is rounded down. Futures: whole contracts. Forex: steps of 0.01 lots. Crypto: steps of 0.001 coins.
- Crypto prices in USDT, USDC, FDUSD, BUSD, DAI, TUSD, USDP or USD1 count as US dollars on a US dollar account.
- For other prices, like ETHBTC, the script asks TradingView for the exchange rate. If the rate is missing, the last line of the panel says so. Then the size uses a rate of 1.
- The record counts one trade at a time. A trade ends at its stop, at its target or at the next opposite signal.
- Sometimes the stop and the target are both inside one candle. Then the script counts the stop. That is the worse case.
What is different.
Many free scripts show arrows and targets. This one also tells you how much to trade for the money you want to risk. It shows its own losses and its worst losing streak on your chart. So you can see how the signals really did on your market before you use them.
Limits.
- The record is the past on one chart. It does not include spread, slippage or commission. These are small costs of every trade. It is not a forecast.
- Trend signals lose when the price moves sideways. Losing streaks are normal.
- A stop does not always fill at your price. If the price jumps past your stop (a gap), the loss can be bigger than you planned.
- This is not financial advice and not a recommendation to trade. Test on a demo account first.
Why you can still trust it. The record counts every past signal on your chart, wins and losses, with the worst losing streak. You can check it yourself before you use a single signal.
Make it a habit. Before you take a signal, read the plan and the size in the panel.
Open source (MPL 2.0). Not affiliated with any broker or prop firm.

Haftungsausschluss
Die Informationen und Veröffentlichungen sind nicht als Finanz-, Anlage-, Handels- oder andere Arten von Ratschlägen oder Empfehlungen gedacht, die von TradingView bereitgestellt oder gebilligt werden, und stellen diese nicht dar. Lesen Sie mehr in den Nutzungsbedingungen.
Haftungsausschluss
Die Informationen und Veröffentlichungen sind nicht als Finanz-, Anlage-, Handels- oder andere Arten von Ratschlägen oder Empfehlungen gedacht, die von TradingView bereitgestellt oder gebilligt werden, und stellen diese nicht dar. Lesen Sie mehr in den Nutzungsbedingungen.