Aktualisiert
AlgoStorm Gamma Exposure Levels (GEX-L)
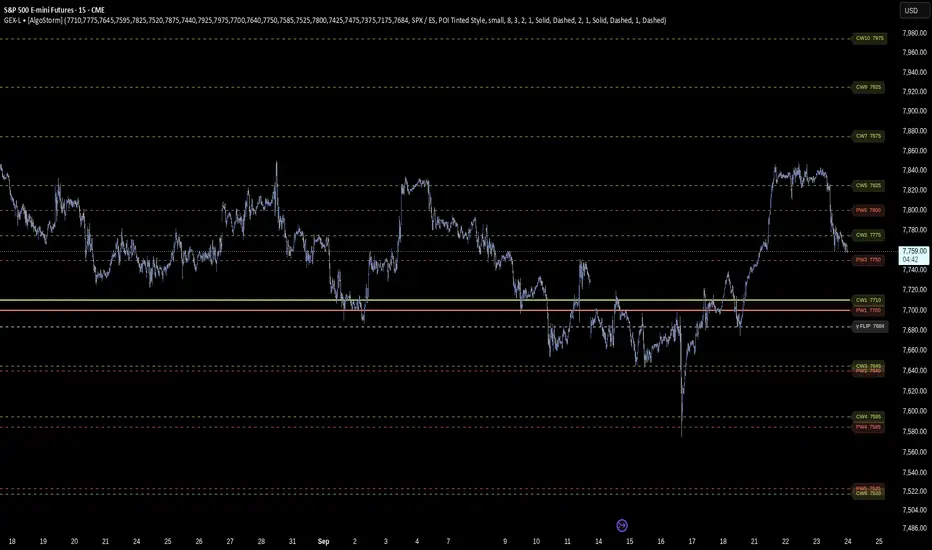
AlgoStorm Gamma Exposure Levels (GEX-L)
A high-performance options market structure visualization tool designed to map total Gamma Exposure (GEX) profiles, Call Walls, Put Walls, and Gamma Flips directly onto your charts using custom-pasted external options chain inputs.
The AlgoStorm Gamma Exposure Levels (GEX-L) indicator is designed for active index and futures traders who track institutional options positioning to map structural support, resistance, and volatility inflection boundaries. It translates raw options chain metrics into actionable on-chart structural lines. By default, it supports mapping across SPX (cash index), ES/MES futures, and SPY ETF charts through localized scaling engines.
Technical Architecture: Anti-Overlap Stagger Pipeline
Traditional horizontal level indicators frequently suffer from visual clutter and illegible text labels when key options strikes or walls cluster tightly together. To bypass this platform constraint, this script utilizes an advanced multi-array sorting and layout engine:
Features & Functionality
A high-performance options market structure visualization tool designed to map total Gamma Exposure (GEX) profiles, Call Walls, Put Walls, and Gamma Flips directly onto your charts using custom-pasted external options chain inputs.
The AlgoStorm Gamma Exposure Levels (GEX-L) indicator is designed for active index and futures traders who track institutional options positioning to map structural support, resistance, and volatility inflection boundaries. It translates raw options chain metrics into actionable on-chart structural lines. By default, it supports mapping across SPX (cash index), ES/MES futures, and SPY ETF charts through localized scaling engines.
CRITICAL DATA INPUT REQUIREMENT — READ BEFORE LOADING
This indicator DOES NOT come with an automatic or built-in options data feed. It operates as a blank visualization engine. To use it, you must copy a standardized 11-value comma-separated (CSV) data string from your external options data provider and paste it manually into the "GEX Data" field inside the indicator settings. The script parses this input to draw static levels for your trading session. It will remain empty until you provide data.
Technical Architecture: Anti-Overlap Stagger Pipeline
Traditional horizontal level indicators frequently suffer from visual clutter and illegible text labels when key options strikes or walls cluster tightly together. To bypass this platform constraint, this script utilizes an advanced multi-array sorting and layout engine:
- True Price Isolation: Horizontal level lines are drawn strictly at their accurate options execution strikes, extending across your historical chart data.
- Permutation Sorting Pass: The execution engine takes all active inputs and dynamically sorts them from lowest price to highest price on every new market tick.
- Algorithmic Staggering Array: A secondary layout pass evaluates the vertical proximity of text tags in your chart margins. If adjacent tags fall below your user-defined point-separation threshold, the text labels are mathematically shifted away from each other along the Y-axis. This ensures that every price label remains completely readable without altering the true location of the price lines.
Features & Functionality
- Multi-Tiered Level Layouts: Maps primary macro anchors (Primary Call Wall CW1, Primary Put Wall PW1, and Gamma Flip) using heavy line styling, alongside up to four distinct secondary levels (CW2–CW5 and PW2–PW5) for deeper context into out-of-the-money open interest.
- Intelligent Symbol Scaling Engine: Built-in auto-scaling logic bridges index options structure with retail trading instruments. When toggled to SPY mode, the script automatically scales your pasted SPX options data by dividing values by 10 to perfectly align with your ETF chart grid.
- Luminance-Sensing Contrast Badges: Features customizable label styles, including a modern solid badge layout. The script calculates the relative luminance of your chosen level colors to automatically determine whether to render black or white text on top of the background badge, preventing visual washout.
- Opaque Visibility Overrides: Built with an explicit alpha channel stripping mechanism. Secondary levels can be configured with dimmed, low-opacity line styles to keep your main chart clean, while their text tags remain 100% opaque and sharp inside the margin.
- Dynamic Trapped Zone Fills: Renders a background color cloud across the macro zone separating the primary Call Wall and Put Wall. The background dynamically transforms its color state depending on whether the current market price is safely insulated inside the wall boundaries or breaking out into high-volatility territory.
Versionshinweise
- Improve the comments.
Versionshinweise
- GEX Data input format changed from 11 to 21 values.
- New format: cw1–cw10,pw1–pw10,flip (21 comma-separated values)
Versionshinweise
- Six setting titles now read CW2-10 / PW2-10 instead of CW2-5 / PW2-5, to match the ten levels per side the script draws: Secondary Call Walls color, CW2-10 Line Thickness, CW2-10 Line Pattern, Secondary Put Walls color, PW2-10 Line Thickness and PW2-10 Line Pattern.
- Titles only. No calculation, default value or level changes, and saved settings carry over.
Versionshinweise
- New setting, Futures Basis Adjustment (Symbol Scaling Mode group). ES and MES trade above the SPX index by the carry basis, tens of points when expiry is months away, so SPX strike levels plotted unchanged sat that much too low on a futures chart.
- Auto, the default, measures chart close minus SPX close on the latest bar where both traded and shifts every level by it. On an SPX chart the shift is zero. It works on any timeframe of one minute or more; where chart bars do not open with SPX bars (1 hour, daily), it pairs the closes of matching 15-minute bars inside each chart bar.
- Manual shifts by a figure you enter in points; Off plots the SPX strikes unchanged. A small note on the last bar shows the shift applied.
- SPY mode now measures the SPY ÷ SPX ratio the same way (about 0.0997, from dividends and fees) instead of dividing by exactly 10, which put SPY levels about a quarter of a percent high. The label shows the factor used; Manual and Off, or a timeframe it cannot measure on, keep ÷10.
- The three new settings are added after the existing ones, so saved settings carry over. Charts already using the script show levels shifted by the basis, or by the measured SPY ratio, after this update; that is the fix.
Versionshinweise
- New Symbol Mode option, NDX / NQ, for levels built from Nasdaq-100 (NDX) index options. NQ and MNQ trade above the NDX index by their own carry basis, so NDX strike levels are shifted onto the futures chart the same way SPX levels are shifted onto ES: Auto measures chart close minus NDX close on the latest bar where both traded; Manual and Off work as before. On an NDX chart the shift is zero.
- New setting, Basis Reference (NDX), default NASDAQ:NDX, used only in NDX / NQ mode.
- A pasted line may now end with a 22nd value naming the index. Lines tagged NDX belong in NDX / NQ mode; lines with 21 values are read as SPX, so every existing paste works unchanged.
- If the pasted line's index does not match the Symbol Mode, the script shows a warning naming the mode to choose and draws no levels, instead of plotting them thousands of points away from price.
- The new option and setting are added after the existing ones, so saved settings carry over. SPX / ES and SPY modes are unchanged.

• Institutional Trading Strategies:
algostorm.com/
• Free Trading Academy:
algostorm.com/trading-academy/
• Free Trading Tools:
(Includes our free SPX/ES and NDX/NQ GEX levels dashboard)
algostorm.com/trading-resources/
algostorm.com/
• Free Trading Academy:
algostorm.com/trading-academy/
• Free Trading Tools:
(Includes our free SPX/ES and NDX/NQ GEX levels dashboard)
algostorm.com/trading-resources/
Haftungsausschluss
Die Informationen und Veröffentlichungen sind nicht als Finanz-, Anlage-, Handels- oder andere Arten von Ratschlägen oder Empfehlungen gedacht, die von TradingView bereitgestellt oder gebilligt werden, und stellen diese nicht dar. Lesen Sie mehr in den Nutzungsbedingungen.
• Institutional Trading Strategies:
algostorm.com/
• Free Trading Academy:
algostorm.com/trading-academy/
• Free Trading Tools:
(Includes our free SPX/ES and NDX/NQ GEX levels dashboard)
algostorm.com/trading-resources/
algostorm.com/
• Free Trading Academy:
algostorm.com/trading-academy/
• Free Trading Tools:
(Includes our free SPX/ES and NDX/NQ GEX levels dashboard)
algostorm.com/trading-resources/
Haftungsausschluss
Die Informationen und Veröffentlichungen sind nicht als Finanz-, Anlage-, Handels- oder andere Arten von Ratschlägen oder Empfehlungen gedacht, die von TradingView bereitgestellt oder gebilligt werden, und stellen diese nicht dar. Lesen Sie mehr in den Nutzungsbedingungen.