Aktualisiert
ICT Essentials [LDT]
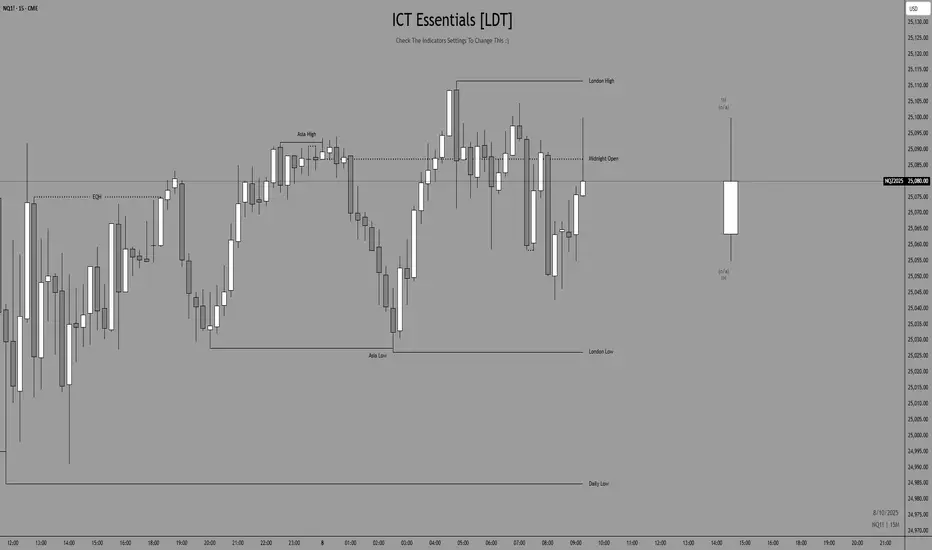
ICT Essentials [LDT]
Overview
ICT Essentials [LDT] is an all-in-one trading utility built to create a natural and efficient workflow for ICT-based traders.
Every component has been designed to integrate seamlessly and update dynamically across timeframes.
The indicator focuses on clarity, performance and customization, allowing traders to tailor every part of their trading experience.
Equal Highs & Lows
This feature automatically detects and marks Equal Highs (EQH) and Equal Lows (EQL) with full control over visuals and behavior.
Users can customize line colors, widths, and styles, label size, color, background transparency and text offset.
The logic uses an optimized scanning and caching system that maintains smooth performance even on higher timeframes.
It provides a precise and adaptive way to identify structural liquidity points whilst keeping the chart clean and readable.

Killzones & Session Pivots
Plots the main trading sessions such as Asia, London and New York (AM, Lunch, PM) with full flexibility and styling options.
Each session can be enabled or disabled individually, with its own color, transparency and label preferences.
Session highs and lows are automatically tracked and plotted as pivots with extension modes like Until Mitigated or Past Mitigation.
This system gives traders the ability to organize market sessions exactly how they prefer whilst keeping the chart consistent and efficient.

Daily Pivots and Tier System
Alongside session pivots, the script tracks daily highs and lows to provide a broader structural view of price. These pivots are stored and displayed on the chart with their appearance updating automatically when price interacts with them.
The system includes a unique tier-based visibility filter that maintains a clean chart by preventing duplicate or overlapping pivots. Recent daily pivots are cached and compared to session pivots and when two levels fall within a defined proximity, the redundant one is automatically hidden. This creates a clear hierarchy of daily and session levels, keeping the most relevant structure visible whilst removing noise.
All aspects of the daily pivot system are fully customizable, including the number of tracked pivots, color, style settings and how mitigated levels are handled. The caching and filtering logic ensures smooth performance and a visually organized workspace even as the data updates in real time.

Key Times
Allows up to five custom key time markers such as the Midnight Open, 6:00 AM or 10:00 AM.
Each marker can be fully customized with its own text, color, line style and thickness.
This makes it simple to visualize key reaction points that align with each traders timing model.

Higher Timeframe Candles
Displays higher timeframe candles such as 1H, 4H or Daily directly on the active chart to provide context without switching views.
Users can customize body, wick and border colors, along with adding optional trace lines for the open, close, high and low and can also show the countdown timers for remaining candle time.
Adjustable spacing, positioning and label visibility makes the display blend naturally with any trading setup.
This module helps traders connect multiple timeframes visually in a clean and intuitive way.

Watermark
Adds a customizable watermark with title, subtitle and symbol or timeframe information.
Every element can be adjusted for color, size, transparency, alignment and position.
The result is a polished, professional chart layout that adapts to the user's personal style.

Optimization and Design
ICT Essentials [LDT] is built for performance, using cached arrays and lightweight calculations to maintain responsiveness on all timeframes.
Each feature can be toggled individually to suit the traders focus or system performance.
The script delivers a fluid, customizable and highly optimized trading experience designed to feel natural and effortless in day-to-day use.
Credits
This script takes reference and inspiration from several open-source indicators:
Equal Highs and Lows by jzstur
ICT HTF Candles (fadi) by fadizeidan
ICT Killzones + Pivots [TEO] EP by tradeforopp
AG FX - Watermark by AGFXTRADING
All components have been refactored, optimized and unified into a single framework for a smoother and more efficient workflow.
Overview
ICT Essentials [LDT] is an all-in-one trading utility built to create a natural and efficient workflow for ICT-based traders.
Every component has been designed to integrate seamlessly and update dynamically across timeframes.
The indicator focuses on clarity, performance and customization, allowing traders to tailor every part of their trading experience.
Equal Highs & Lows
This feature automatically detects and marks Equal Highs (EQH) and Equal Lows (EQL) with full control over visuals and behavior.
Users can customize line colors, widths, and styles, label size, color, background transparency and text offset.
The logic uses an optimized scanning and caching system that maintains smooth performance even on higher timeframes.
It provides a precise and adaptive way to identify structural liquidity points whilst keeping the chart clean and readable.
Killzones & Session Pivots
Plots the main trading sessions such as Asia, London and New York (AM, Lunch, PM) with full flexibility and styling options.
Each session can be enabled or disabled individually, with its own color, transparency and label preferences.
Session highs and lows are automatically tracked and plotted as pivots with extension modes like Until Mitigated or Past Mitigation.
This system gives traders the ability to organize market sessions exactly how they prefer whilst keeping the chart consistent and efficient.
Daily Pivots and Tier System
Alongside session pivots, the script tracks daily highs and lows to provide a broader structural view of price. These pivots are stored and displayed on the chart with their appearance updating automatically when price interacts with them.
The system includes a unique tier-based visibility filter that maintains a clean chart by preventing duplicate or overlapping pivots. Recent daily pivots are cached and compared to session pivots and when two levels fall within a defined proximity, the redundant one is automatically hidden. This creates a clear hierarchy of daily and session levels, keeping the most relevant structure visible whilst removing noise.
All aspects of the daily pivot system are fully customizable, including the number of tracked pivots, color, style settings and how mitigated levels are handled. The caching and filtering logic ensures smooth performance and a visually organized workspace even as the data updates in real time.
Key Times
Allows up to five custom key time markers such as the Midnight Open, 6:00 AM or 10:00 AM.
Each marker can be fully customized with its own text, color, line style and thickness.
This makes it simple to visualize key reaction points that align with each traders timing model.
Higher Timeframe Candles
Displays higher timeframe candles such as 1H, 4H or Daily directly on the active chart to provide context without switching views.
Users can customize body, wick and border colors, along with adding optional trace lines for the open, close, high and low and can also show the countdown timers for remaining candle time.
Adjustable spacing, positioning and label visibility makes the display blend naturally with any trading setup.
This module helps traders connect multiple timeframes visually in a clean and intuitive way.
Watermark
Adds a customizable watermark with title, subtitle and symbol or timeframe information.
Every element can be adjusted for color, size, transparency, alignment and position.
The result is a polished, professional chart layout that adapts to the user's personal style.
Optimization and Design
ICT Essentials [LDT] is built for performance, using cached arrays and lightweight calculations to maintain responsiveness on all timeframes.
Each feature can be toggled individually to suit the traders focus or system performance.
The script delivers a fluid, customizable and highly optimized trading experience designed to feel natural and effortless in day-to-day use.
Credits
This script takes reference and inspiration from several open-source indicators:
Equal Highs and Lows by jzstur
ICT HTF Candles (fadi) by fadizeidan
ICT Killzones + Pivots [TEO] EP by tradeforopp
AG FX - Watermark by AGFXTRADING
All components have been refactored, optimized and unified into a single framework for a smoother and more efficient workflow.
Versionshinweise
Updating The ChartVersionshinweise
Key Time SeparatorCreates visual dividers for key session opens such as the Daily Open, Weekly Open or user-defined custom times.
Each separator can be styled individually with adjustable line thickness, color and label visibility for maximum clarity.
Supports both daily and weekly lookback limits, infinite line extensions and text offsets for precise chart alignment.
Ideal for marking session boundaries or reference points, this tool enhances time-based structure recognition with minimal clutter.
This is turned off by default but can be found in the "Key Time Separator" section
Versionshinweise
Higher Timeframe CandlesNow supports displaying up to five candles per selected higher timeframe simultaneously, offering deeper structure and insight at a quick glance.
This enhancement gives traders a richer multi-timeframe perspective while maintaining the clean, integrated look of the chart.
Versionshinweise
Fixed the subtitle alignment and symbol alignmentIt now properly aligns left and right and are in the correct sections within the settings
Versionshinweise
Made a small change to the way the Equal High/Lows handle the textVersionshinweise
Updated the Max Lookback Length from 100 to 250It is still at 100 by default with phone users in mind but can be upped whenever
Versionshinweise
Huge Bug FixFixed the issue where Killzone Pivots like London or Asia were being hidden or not showing up
Also optimised the load time when the Daily Killzone is active
Versionshinweise
Fixed the overlapping text issue again with a new way of handling Daily Highs and LowsThere still is a small issue when the Daily is active that I'm currently working on but as a whole it wont effect performance/visuals or levels and you more then likely wont even spot it lol
Versionshinweise
Attempt TwoThis SHOULD fix the Daily Issues now, if it doesn't please dm me
Versionshinweise
Higher Time Frame Daily PivotsDaily Pivots now have an independent timeframe limit (max 4H), separate from session killzones (max 30m).
This means you can zoom out to higher timeframes and still see important daily high/low levels without the clutter of session boxes - giving you clean charts with the information you need
Versionshinweise
Performance and stability updateThe indicator now runs significantly faster with improved memory management and enhanced error handling.
All existing settings and visual output remain unchanged.
This is a drop-in replacement with full backward compatibility.
Versionshinweise
Update Reverted, there was a small issue on certain assets Versionshinweise
Attempt Two This should fix the original fix update
Versionshinweise
New Week/Day Opening Gap (NWOG & NDOG)Added a new NWOG and NDOG module.
When a gap exists between the previous close and the current open, the indicator will automatically draw the High, Low, and CE (50% equilibrium) levels with optional box shading over the gap range.
Both NWOG and NDOG are fully independent with their own drawing limits, timeframe visibility controls (up to 4H), extend behaviour (Until Mitigated or Past Mitigation), and customisable labels.
Gap direction is detected automatically - on a gap up the CE offsets down on mitigation, on a gap down it offsets up, consistent with how the existing killzone pivots behave.
A shared Hide First Pivot option is also included, which hides the level that price typically taps instantly at the open, keeping the chart clean on instruments that gap frequently.
Versionshinweise
Daily & Weekly Pivot Overhaul + NWOG/NDOG Gap FilterReworked the daily pivots and added weekly pivots. The most recent completed day now shows as "Previous Daily High" and "Previous Daily Low", while older days keep the standard "Daily High/Low" naming. As each new day completes, the old labels update automatically.
Weekly pivots work the same way. The most recent completed week shows as "Previous Weekly High/Low", older weeks show as "Weekly High/Low". Weekly gets its own toggle, colour, drawing limit, and timeframe control (up to 1D), all sitting alongside the daily settings.
Both feed into the tier system. Where a weekly level sits on the same price as a daily one, the weekly takes priority and the daily hides, so the labels no longer stack on shared levels. The full order is now Weekly beats Daily beats Sessions.
Also added a minimum gap size filter to NWOG and NDOG. Set a tick threshold and any gap smaller than it won't draw. This clears the clutter from tiny gaps that stacked labels together. Default is 20 ticks, tune it to whatever you trade, or set it to 0 to show every gap.
The script is also now on Pine Script v6.
Versionshinweise
Code Cleanup & Performance PassWent through the full script and cleared out inefficiencies that had built up across versions. No features added or changed, everything on the chart behaves exactly as before just now a little bit smoother.
Versionshinweise
EQ Levels + Performance OverhaulAdded Previous Daily EQ and Previous Weekly EQ to the Key Times section.
Each line marks the midpoint of the previous daily or weekly candle and anchors at the first bar that traded through that price, forming alongside the Previous Daily and Weekly pivots before extending forward like the other key times.
Daily EQ is on by default, Weekly EQ is off.
Both share the Key Times style, width, and timeframe settings, with their own labels and colours.
This update also rebuilds how the killzone pivot engine spends its time, you now get the same chart with a shorter load time.
Versionshinweise
Small Bug FixSlipped up on an issue with the recent optimisation causing some people to get errors randomly.
Should be fixed now.
Versionshinweise
Mitigated Label PositioningChanged how mitigated pivot labels sit against their lines. The old system pushed the text away by a fixed number of ticks, which meant the gap grew or shrank as you zoomed, so a value that looked right at one zoom level looked wrong at another.
Labels now anchor against the line itself and hold the same visual gap no matter how far in or out you go, matching how the trendline tool positions its text.
This applies to killzone, daily, weekly, and NWOG/NDOG labels, including the CE which still sits below the line on a gap up and above on a gap down.
The old behaviour is still there if you prefer it. Turn off Trendline Style Mitigated Text in the Killzone Pivots section and the tick offset next to it works exactly as before.
5 Minute Example ⬇️
4 Hour Example ⬇️
Versionshinweise
HUGE VISUAL UPDATEAlerts
Added alerts to the indicator. Fourteen events are available in the alert dropdown: killzone high and low mitigated, daily high and low mitigated, weekly high and low mitigated, new All Time High at the day close, All Time High broken intraday and the NWOG and NDOG high, low, and CE fills.
The killzone alerts also come in a named version. Set your alert condition to "Any alert() function call" and the message tells you which session it was, so you get "London high mitigated" rather than a generic one. It uses whatever you have the session named as in the settings, so custom names carry through.
All Time High
Added an All Time High pivot. It marks the highest point of the loaded chart history, anchors at the bar that made it, and updates at the end of the day like the daily pivots do. It sits at the top of the tier system, so if a weekly, daily, or session high lands on the same price, the ATH takes it and the rest hide.
Worth knowing that it reads from the history your chart has loaded, so on lower timeframes it covers less ground than it does on the daily.
Equal Highs and Lows
Reworked how the EQH and EQL text sits on the line. It used to blend in using a background colour you had to set yourself, which looked a mess for anyone running a different chart background. It now reads your actual chart background and matches it automatically, so the text blends properly on any theme with nothing to configure.
There is also a new Above Line option if you would rather have no background at all, and the old manual colour picker is still there under Blend Box (Manual).
Alongside that, equal highs and lows now clear off the chart once price trades through them. Only the levels that still matter stay visible. It is on by default and there is a toggle for it in the settings.
Opening Gaps
Small gaps that fill straight away now clear themselves off the chart. If price trades through the CE within five minutes of the open, the whole gap is removed rather than sitting there as clutter. The window is adjustable and you can turn it off in the settings.
Layering
The indicator now sets itself behind the chart, so the blend boxes and killzone boxes no longer cover your candles or your drawings. If yours is still sitting on top after updating, remove and re-add the indicator, or right click it and choose Visual Order, Send to Back. Objects added mid-session can still layer oddly until you refresh the chart.
Versionshinweise
Small PatchFixed a random runtime error for the Equal Highs/Lows that some of you hit.
Nothing changes visually.
Versionshinweise
Bug FixFixed the All Time High showing the wrong level on lower timeframes
Versionshinweise
Small FixI forgot to failsafe my last update lmao
Should work fine now
Versionshinweise
All Time HighsFixed some issues where it wouldn't act like the set pivot style
Should be all good now, if not i might crash out 😭
Versionshinweise
Killzone Box StylesAdded a Box Style option with three ways to present the killzones.
Normal is the shaded rectangle you already know.
Follow Price shades the running high and low as the session forms, so the fill steps with the candles rather than boxing them.
Bracket floats a named rail above the session with an arrow at each end dropping down to the price on that side.
All three sit under Show Killzone Boxes, so that needs to be on for any of them to appear.
Fixes
Weekly pivots have now been fixed as this week an issue appeared on the 1 minute time frame only, should be smooth sailing from here on out for all time frames
Versionshinweise
Tiny PatchFixed a runtime error a small amount of users hit on the 1 minute.
The weekly pivot could anchor to a bar further back than TradingView allows, which stopped the indicator loading.
Daily and weekly pivots now position themselves by time instead of by bar count, so there's no limit on how far back they can anchor.
This also covers seconds charts, where the same error could have appeared on the dailies.
Nothing changes visually.
Versionshinweise
PatchFixed another runtime error some of you hit on the 1 minute.
Depending on where your chart's history started, the weekly pivots and the Previous Weekly EQ could anchor to a bar further back than TradingView allows, which stopped the indicator loading.
Daily and weekly pivots and the EQ lines now position themselves by time instead, so there's no limit on how far back they can anchor.
This also covers seconds charts. Nothing changes visually.

Haftungsausschluss
Die Informationen und Veröffentlichungen sind nicht als Finanz-, Anlage-, Handels- oder andere Arten von Ratschlägen oder Empfehlungen gedacht, die von TradingView bereitgestellt oder gebilligt werden, und stellen diese nicht dar. Lesen Sie mehr in den Nutzungsbedingungen.
Haftungsausschluss
Die Informationen und Veröffentlichungen sind nicht als Finanz-, Anlage-, Handels- oder andere Arten von Ratschlägen oder Empfehlungen gedacht, die von TradingView bereitgestellt oder gebilligt werden, und stellen diese nicht dar. Lesen Sie mehr in den Nutzungsbedingungen.