FVG MTF - Open Gaps with 50% Tracking
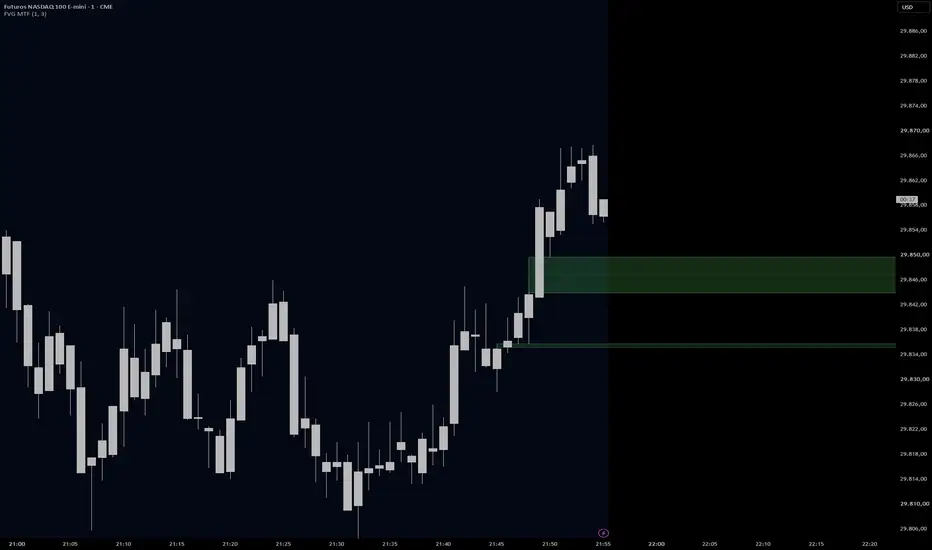
FVG MTF draws Fair Value Gaps (three-candle imbalances) from a chosen timeframe on the current chart and tracks each gap until it is filled.
HOW IT WORKS
• Bullish FVG: the low of the 3rd candle is above the high of the 1st candle.
• Bearish FVG: the high of the 3rd candle is below the low of the 1st candle.
• Only confirmed gaps are drawn: the candle of the selected timeframe must be closed, so gaps do not repaint.
• Shows the N most recent open gaps on each side, from the candle where they formed up to the current bar.
• Each gap changes state as price interacts with it:
- touched: the box turns lighter;
- 50% of the gap reached: the dotted midline becomes solid and highlighted;
- filled (a close beyond the whole gap): the gap is removed.
• If the selected timeframe is lower than the chart timeframe, the chart timeframe is used.
• Options to extend the boxes to the right and/or left, and editable colors.
HOW TO USE
Use open gaps as areas where price moved with imbalance and may react on a return. The touched and 50% states show how deep the return went, which helps separate a shallow test from a full rebalance. A common setup is to read M5 gaps on an M1 chart.
It works well alongside Sigma Map, which draws volatility-based levels from the session open: a gap forming near a sigma level gives two independent references in the same area.
Alerts are available for new bullish and new bearish gaps.
LIMITATIONS
• A gap is a reference area, not a signal.
• "Filled" is judged by the close of the chart bar, so a wick through the gap does not remove it.
• On very low timeframes, many small gaps can appear; increase the FVG timeframe or reduce the number of gaps per side.
HOW IT WORKS
• Bullish FVG: the low of the 3rd candle is above the high of the 1st candle.
• Bearish FVG: the high of the 3rd candle is below the low of the 1st candle.
• Only confirmed gaps are drawn: the candle of the selected timeframe must be closed, so gaps do not repaint.
• Shows the N most recent open gaps on each side, from the candle where they formed up to the current bar.
• Each gap changes state as price interacts with it:
- touched: the box turns lighter;
- 50% of the gap reached: the dotted midline becomes solid and highlighted;
- filled (a close beyond the whole gap): the gap is removed.
• If the selected timeframe is lower than the chart timeframe, the chart timeframe is used.
• Options to extend the boxes to the right and/or left, and editable colors.
HOW TO USE
Use open gaps as areas where price moved with imbalance and may react on a return. The touched and 50% states show how deep the return went, which helps separate a shallow test from a full rebalance. A common setup is to read M5 gaps on an M1 chart.
It works well alongside Sigma Map, which draws volatility-based levels from the session open: a gap forming near a sigma level gives two independent references in the same area.
Alerts are available for new bullish and new bearish gaps.
LIMITATIONS
• A gap is a reference area, not a signal.
• "Filled" is judged by the close of the chart bar, so a wick through the gap does not remove it.
• On very low timeframes, many small gaps can appear; increase the FVG timeframe or reduce the number of gaps per side.

Haftungsausschluss
Die Informationen und Veröffentlichungen sind nicht als Finanz-, Anlage-, Handels- oder andere Arten von Ratschlägen oder Empfehlungen gedacht, die von TradingView bereitgestellt oder gebilligt werden, und stellen diese nicht dar. Lesen Sie mehr in den Nutzungsbedingungen.
Haftungsausschluss
Die Informationen und Veröffentlichungen sind nicht als Finanz-, Anlage-, Handels- oder andere Arten von Ratschlägen oder Empfehlungen gedacht, die von TradingView bereitgestellt oder gebilligt werden, und stellen diese nicht dar. Lesen Sie mehr in den Nutzungsbedingungen.