Prism Intelligence SPX GEX Confluence and Sniper Entry System
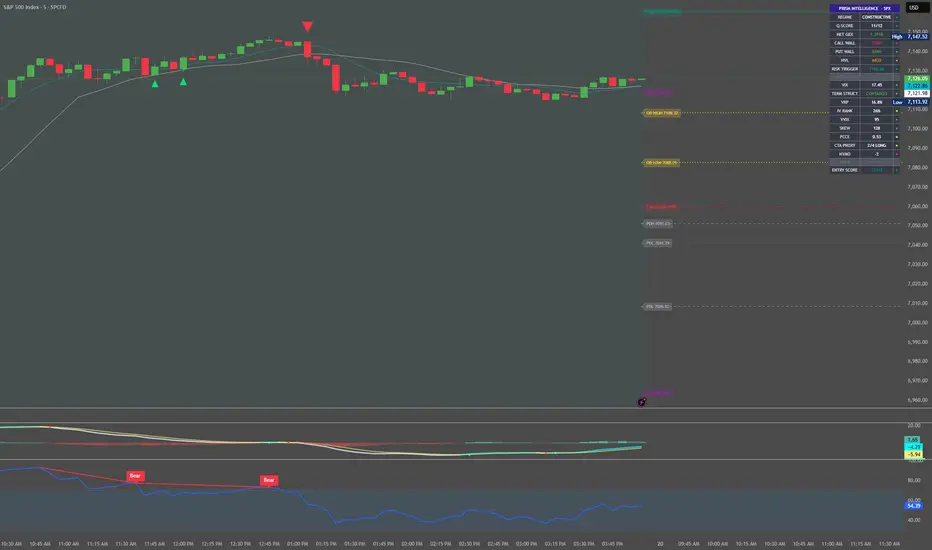
Prism Intelligence SPX is a professional-grade overlay indicator built specifically
for SPX intraday and swing trading. It combines dealer gamma exposure (GEX) levels,
volatility regime analysis, and a 12-component confluence scoring system to identify
high-conviction long entries and precise exits — with zero signal noise between
setups.
The indicator is designed to be updated once before the open each session using
inputs from your GEX data provider or newsletter, then left to run autonomously
throughout the day.
━━━━━━━━━━━━━━━━━━━━━━━━━━━━━━━━━━━━━━━━
⚠️ DATA SUBSCRIPTION NOTICE
━━━━━━━━━━━━━━━━━━━━━━━━━━━━━━━━━━━━━━━━
This indicator fetches the following external symbols via request.security(). Some
may require a paid data subscription depending on your TradingView account tier:
• CBOE:VIX — CBOE Volatility Index
• CBOE:VIX3M — CBOE 3-Month Volatility Index
• CBOE:VVIX — CBOE Volatility of Volatility Index
• CBOE:SKEW — CBOE SKEW Index
• USI:PCCE — CBOE Equity Put/Call Ratio
• USI:ADVN.NY — NYSE Advancing Issues
• USI:DECL.NY — NYSE Declining Issues
If any of these display as N/A in the dashboard table, check your TradingView data
permissions under Profile → Manage Plan → Data.
━━━━━━━━━━━━━━━━━━━━━━━━━━━━━━━━━━━━━━━━
⚠️ DISCLAIMER
━━━━━━━━━━━━━━━━━━━━━━━━━━━━━━━━━━━━━━━━
This indicator is provided for informational and educational purposes only. It does
not constitute financial advice, a recommendation to buy or sell any security, or a
guarantee of any particular outcome. All trading involves risk, including the
possible loss of principal. Past signal performance does not guarantee future
results. You are solely responsible for your own trading decisions. Always conduct
your own research and consult a qualified financial advisor before making any
investment decisions.
━━━━━━━━━━━━━━━━━━━━━━━━━━━━━━━━━━━━━━━━
HOW IT WORKS — THREE-LAYER ARCHITECTURE
━━━━━━━━━━━━━━━━━━━━━━━━━━━━━━━━━━━━━━━━
LAYER 1 — MACRO REGIME CONTEXT
A 12-point confluence score is calculated from a combination of session inputs and
auto-fetched market data. The score determines whether conditions favor aggressive
positioning, cautious positioning, or staying flat. A score of 9 or higher with
price above the HVL (gamma flip level) is required for any long signal to activate.
LAYER 2 — LOCAL TREND FILTER
The MA9 slope and price position relative to MA9 are evaluated on every bar. Long
signals are fully suppressed when short-term momentum is declining — this prevents
buying into intraday downtrends even when the macro score is green.
LAYER 3 — PRECISION ENTRY TRIGGER
Within the right macro and trend context, signals fire on specific price-action
events: MA20 reclaims, MA9 reclaims, opening range momentum confirmation (bars
3–8 of the session), HVL reclaims, and key level bounces. Exits fire on MA20
breaks or HVL loss.
━━━━━━━━━━━━━━━━━━━━━━━━━━━━━━━━━━━━━━━━
SIGNALS ON CHART
━━━━━━━━━━━━━━━━━━━━━━━━━━━━━━━━━━━━━━━━
🔺 TEAL TRIANGLE — Sniper Long (below bar)
Highest conviction long entry. Score ≥9, above HVL, local uptrend confirmed,
triggered by MA20 reclaim, HVL reclaim, opening momentum confirmation, or key
level bounce (HVL / Put Wall / Lower Band).
🔺 LIME TRIANGLE — Aggressive Long (below bar)
Faster entry off MA9 reclaim in the same high-score context. Suitable for
momentum continuation or scalp trades. Fires only when not already covered by
a Sniper Long on the same bar.
◆ YELLOW DIAMOND — Caution (below bar)
Score 6–8 with valid MA reclaim and local uptrend. Setup is valid but conviction
is lower — consider reducing size or using tighter stops.
🔻 RED TRIANGLE — Exit (above bar)
MA20 broken in a high-score regime, or HVL broken at any score, or confluence
score collapsed below 6. Get flat or tighten stops immediately.
✕ RED X — HVL Breach (above bar)
Price crossed below the gamma flip level. Regime may be shifting bearish — treat
all long exposure with caution until price reclaims HVL.
━━━━━━━━━━━━━━━━━━━━━━━━━━━━━━━━━━━━━━━━
AUTOMATIC LEVEL OVERLAY
━━━━━━━━━━━━━━━━━━━━━━━━━━━━━━━━━━━━━━━━
All levels extend right with labeled price callouts. No extra input required.
DAILY EXPECTED MOVE ±1σ (purple dashed)
Derived from VIX using the standard dealer pricing formula:
prev_close × (VIX / 100) / √252
Upper and lower bands represent the 1-standard-deviation daily range that options
dealers are pricing. Price reaching either band mid-session is a natural
mean-reversion reference and often marks an intraday exhaustion point.
OPENING RANGE HIGH / LOW (yellow dotted)
High and low of the first N bars of RTH (default 6 bars = 30 minutes on a 5-min
chart, configurable in settings). OR High breakout signals momentum continuation;
OR Low breakdown signals potential intraday reversal. Among the most reliable
intraday reference levels for SPX specifically.
PREVIOUS DAY HIGH / CLOSE / LOW (silver dashed)
Non-repainting confirmed daily OHLC. PDH and PDL define the overnight reference
frame and are key levels for gap analysis. PDC is the primary overnight positioning
level — price often gravitates here when the session lacks a directional catalyst.
MANUAL SESSION LEVELS (drawn from your inputs each session)
• Call Wall (red dashed) — Primary dealer call resistance strike
• Put Wall (green dashed) — Primary 0DTE dealer put support strike
• HVL (orange solid) — Gamma flip level / regime boundary
• Risk Trigger (teal solid) — Primary swing model upside target
• Lower Band (blue dotted) — Swing model downside support
━━━━━━━━━━━━━━━━━━━━━━━━━━━━━━━━━━━━━━━━
BACKGROUND ZONE COLORING
━━━━━━━━━━━━━━━━━━━━━━━━━━━━━━━━━━━━━━━━
Faint teal — Score ≥9 and above HVL. Full green light environment.
Faint yellow — Score 6–8 and above HVL. Cautious but tradeable.
Faint red — Price below HVL. Danger zone — long bias suspended.
Colors apply only to confirmed closed bars and do not fill future bars.
━━━━━━━━━━━━━━━━━━━━━━━━━━━━━━━━━━━━━━━━
DASHBOARD TABLE (top-right corner)
━━━━━━━━━━━━━━━━━━━━━━━━━━━━━━━━━━━━━━━━
All 20 rows update in real time. Color-coded status dot on each row.
MANUAL INPUTS (update before the open each session):
Regime CONSTRUCTIVE / TRANSITIONAL / CONTESTED / BEARISH
Q-Score MenthorQ composite score 0–12
Net GEX Net dealer gamma in billions (positive = pinning environment)
Call Wall Primary dealer call resistance strike
Put Wall Primary 0DTE put support strike
HVL Gamma flip / regime boundary
Risk Trigger Primary swing model upside target
Lower Band Swing model downside support
AUTO-CALCULATED (live, no input required):
VIX Spot implied volatility + compressing/expanding status
Term Struct CONTANGO (VIX < VIX3M) or BACKWARDATION — regime indicator
VRP Volatility Risk Premium (VIX minus 30-day HV annualized)
IV Rank VIX percentile over trailing 252 bars
VVIX Vol-of-vol — green below 100, red above 110
SKEW Tail risk — green below 130, red above 140
PCCE Equity put/call ratio — green above 0.80 (contrarian long)
CTA Proxy Price vs MA20/50/200 structure (0–4 long signals)
NYMO NYSE McClellan Oscillator (calculated from ADVN/DECL)
Entry Score Total confluence score /12 with teal/yellow/red color coding
━━━━━━━━━━━━━━━━━━━━━━━━━━━━━━━━━━━━━━━━
MANUAL INPUTS — FULL REFERENCE
━━━━━━━━━━━━━━━━━━━━━━━━━━━━━━━━━━━━━━━━
Input Range Description
─────────────────────────────────────────────────────────────────
Regime 4 options CONSTRUCTIVE (+2), TRANSITIONAL (+1),
CONTESTED (0), BEARISH (0)
Q-Score 0–12 MenthorQ composite score
Net GEX (B) any Net gamma in billions. Positive = dealer
pinning, negative = dealer amplifying moves
Call Wall price Largest dealer call OI strike (resistance)
Put Wall price Largest 0DTE dealer put OI strike (support)
HVL price Gamma flip level — the most important level.
Above = dealers buy dips; Below = dealers
sell rallies
Risk Trigger price Primary swing model upside target
Lower Band price Primary swing model downside support
CTA Z-Score -3 to 3 CTA equity positioning z-score (MenthorQ)
L/S Barometer 0–0.5 Long/short vol barometer (low = less hedging)
Vol Control any Vol control fund ratio (≤1.05 = re-entry zone)
Expiry 3 options MONTHLY / WEEKLY / NONE (context only)
━━━━━━━━━━━━━━━━━━━━━━━━━━━━━━━━━━━━━━━━
CONFLUENCE SCORING — HOW POINTS ARE ASSIGNED
━━━━━━━━━━━━━━━━━━━━━━━━━━━━━━━━━━━━━━━━
Component Max Condition
──────────────────────────────────────────────────────────────────
Regime 2 CONSTRUCTIVE=2, TRANSITIONAL=1, else 0
Q-Score 2 ≥10=2, ≥7=1, else 0
Net GEX positive 1 GEX > 0
VIX compressing 1 VIX < MA10 < MA20
Term contango 1 VIX < VIX3M
VVIX calm 1 VVIX < 100
SKEW not extreme 1 SKEW < 135
PCCE elevated 1 PCCE > 0.80 (contrarian long)
CTA constructive 1 CTA Z-Score > 0.5
Low hedging demand 1 L/S Barometer < 0.20
Vol control entry 1 Vol ratio ≤ 1.05
Positive breadth 1 NYMO > 0
──────────────────────────────────────────────────────────────────
TOTAL 12
Score ≥9 + above HVL → Sniper Long eligible
Score 6–8 + above HVL → Caution Long eligible
Score <6 or below HVL → No long signals
━━━━━━━━━━━━━━━━━━━━━━━━━━━━━━━━━━━━━━━━
SETTINGS
━━━━━━━━━━━━━━━━━━━━━━━━━━━━━━━━━━━━━━━━
Opening Range bars (default 6):
Adjust for your timeframe —
5-min chart: 6 bars = 30 min OR, 3 bars = 15 min OR
1-min chart: 30 bars = 30 min OR
15-min chart: 2 bars = 30 min OR
Individual toggles for Daily EM, Opening Range, and Prev Day levels.
All can be turned off independently if the chart becomes crowded.
━━━━━━━━━━━━━━━━━━━━━━━━━━━━━━━━━━━━━━━━
BEST TIMEFRAMES
━━━━━━━━━━━━━━━━━━━━━━━━━━━━━━━━━━━━━━━━
Recommended: 5-minute and 15-minute
Compatible symbols: SPX, SPCFD, SPY, ES1!, MES1!
The 12-point scoring system is session-level — update the manual inputs once
before the open. The signal triggers (MA crossovers, level bounces) fire
automatically throughout the session.
━━━━━━━━━━━━━━━━━━━━━━━━━━━━━━━━━━━━━━━━
ALERTS
━━━━━━━━━━━━━━━━━━━━━━━━━━━━━━━━━━━━━━━━
Five alert conditions are built in. Set them via the Alerts panel (⏰) once the
indicator is on your chart:
• Prism Sniper Long — Highest conviction entry
• Prism Aggressive Long — Faster MA9-based entry
• Prism Caution — Score 6–8 setup
• Prism Exit — Exit or stop-tighten signal
• HVL Breach — Gamma flip level lost
━━━━━━━━━━━━━━━━━━━━━━━━━━━━━━━━━━━━━━━━
RELATED RESOURCES
━━━━━━━━━━━━━━━━━━━━━━━━━━━━━━━━━━━━━━━━
Manual inputs are designed to work directly with data from:
• MenthorQ (Q-Score, CTA Z-Score, L/S Barometer, Vol Control Ratio)
• SpotGamma, SqueezeMetrics, or similar GEX providers
(Call Wall, Put Wall, HVL, Net GEX)
The Prism Intelligence newsletter publishes these values prior to each session.

Haftungsausschluss
Die Informationen und Veröffentlichungen sind nicht als Finanz-, Anlage-, Handels- oder andere Arten von Ratschlägen oder Empfehlungen gedacht, die von TradingView bereitgestellt oder gebilligt werden, und stellen diese nicht dar. Lesen Sie mehr in den Nutzungsbedingungen.
Haftungsausschluss
Die Informationen und Veröffentlichungen sind nicht als Finanz-, Anlage-, Handels- oder andere Arten von Ratschlägen oder Empfehlungen gedacht, die von TradingView bereitgestellt oder gebilligt werden, und stellen diese nicht dar. Lesen Sie mehr in den Nutzungsbedingungen.