OPEN-SOURCE SCRIPT
Monotonicity Index [LuxAlgo]
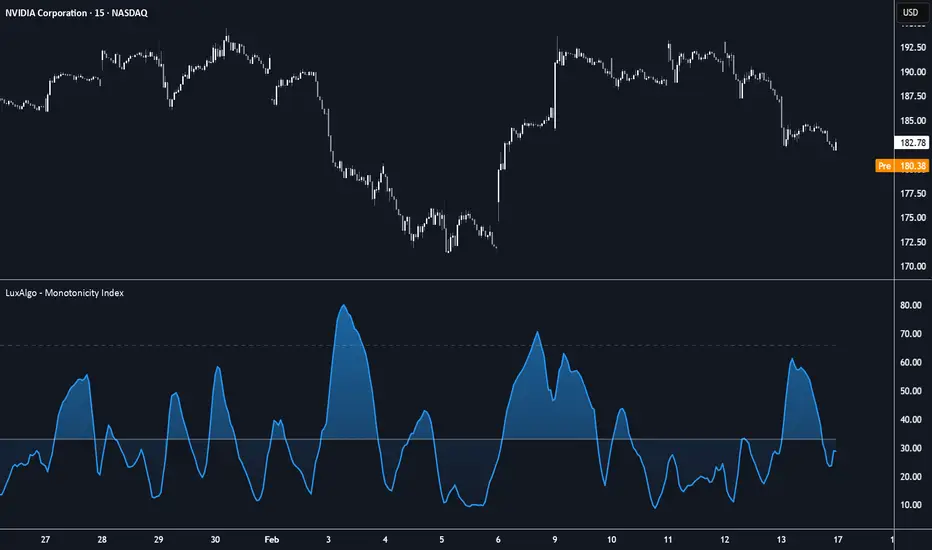
The Monotonicity Index indicator measures the structural consistency of price action by comparing market movement to an optimal monotonic (ever-increasing or ever-decreasing) fit. Using Isotonic Regression via the Pool Adjacent Violators Algorithm (PAVA), this tool provides a quantitative measure of whether a market is trending efficiently or moving with high complexity/noise.
🔶 USAGE
The indicator is displayed in a separate pane and oscillates based on the structural "smoothness" of price. It is primarily used to distinguish between trending environments and choppy or mean-reverting phases.
🔹 Index Modes
The tool offers two distinct ways to interpret market structure:
🔹 Interpretation
The indicator includes a dynamic Cumulative Mean and an Upper Bound to help provide context to the current readings:
🔶 DETAILS
At the core of this indicator is the Isotonic Regression calculated via the PAVA algorithm. Unlike standard moving averages or linear regressions that assume a specific shape (like a straight line), Isotonic Regression finds the "best fit" that is strictly non-decreasing or non-increasing.
The script performs two simultaneous fits (one bullish, one bearish) and selects the one with the lowest Mean Squared Error (MSE). By analyzing how many "pools" (constant segments) the algorithm creates or how much the price deviates from this "ideal" trend, we can mathematically define the quality of a trend without the lag associated with traditional momentum oscillators.
🔶 SETTINGS
🔶 USAGE
The indicator is displayed in a separate pane and oscillates based on the structural "smoothness" of price. It is primarily used to distinguish between trending environments and choppy or mean-reverting phases.
🔹 Index Modes
The tool offers two distinct ways to interpret market structure:
- Efficiency: This mode calculates the ratio between the net movement of the best-fit monotonic trend and the total price path (volatility). A high value indicates a "straight-line" trend where every movement contributes to the direction. Low values indicate "exhausted" or "noisy" movement where price travels a long distance to end up near the same point.
- Complexity: This mode measures the number of segments (pools) required to fit the data. A low complexity value suggests the market is following a simple, clear path. High complexity suggests the market is frequently changing local direction, characteristic of range-bound or "choppy" price action.
🔹 Interpretation
The indicator includes a dynamic Cumulative Mean and an Upper Bound to help provide context to the current readings:
- Above Mean: When the Efficiency index is above its mean, the current trend is more "monotonic" and stable than average.
- Below Mean: Readings below the mean suggest that price action is becoming fragmented, potentially signaling a transition into a range or a trend reversal.
🔶 DETAILS
At the core of this indicator is the Isotonic Regression calculated via the PAVA algorithm. Unlike standard moving averages or linear regressions that assume a specific shape (like a straight line), Isotonic Regression finds the "best fit" that is strictly non-decreasing or non-increasing.
The script performs two simultaneous fits (one bullish, one bearish) and selects the one with the lowest Mean Squared Error (MSE). By analyzing how many "pools" (constant segments) the algorithm creates or how much the price deviates from this "ideal" trend, we can mathematically define the quality of a trend without the lag associated with traditional momentum oscillators.
🔶 SETTINGS
- Source: The price data used for the calculation (default is Close).
- Period: The lookback window for the Isotonic Regression fit. A larger period analyzes long-term structural trends, while a shorter period reacts to local price swings.
- Index Mode: Switches between Efficiency (ratio of trend to volatility) and Complexity (number of segments in the fit).
- Index Smoothing: Applies a Simple Moving Average to the raw index to filter out high-frequency noise and provide a smoother line.
- Index Color: Adjusts the visual color of the index line and its associated gradient fill.
Open-source Skript
Ganz im Sinne von TradingView hat dieser Autor sein/ihr Script als Open-Source veröffentlicht. Auf diese Weise können nun auch andere Trader das Script rezensieren und die Funktionalität überprüfen. Vielen Dank an den Autor! Sie können das Script kostenlos verwenden, aber eine Wiederveröffentlichung des Codes unterliegt unseren Hausregeln.

All content & scripts provided by LuxAlgo are for educational purposes only and are not financial advice.
Haftungsausschluss
Die Informationen und Veröffentlichungen sind nicht als Finanz-, Anlage-, Handels- oder andere Arten von Ratschlägen oder Empfehlungen gedacht, die von TradingView bereitgestellt oder gebilligt werden, und stellen diese nicht dar. Lesen Sie mehr in den Nutzungsbedingungen.
Open-source Skript
Ganz im Sinne von TradingView hat dieser Autor sein/ihr Script als Open-Source veröffentlicht. Auf diese Weise können nun auch andere Trader das Script rezensieren und die Funktionalität überprüfen. Vielen Dank an den Autor! Sie können das Script kostenlos verwenden, aber eine Wiederveröffentlichung des Codes unterliegt unseren Hausregeln.
Haftungsausschluss
Die Informationen und Veröffentlichungen sind nicht als Finanz-, Anlage-, Handels- oder andere Arten von Ratschlägen oder Empfehlungen gedacht, die von TradingView bereitgestellt oder gebilligt werden, und stellen diese nicht dar. Lesen Sie mehr in den Nutzungsbedingungen.