Liquidity Expansion Radar PRO [Thomas]
Introduction
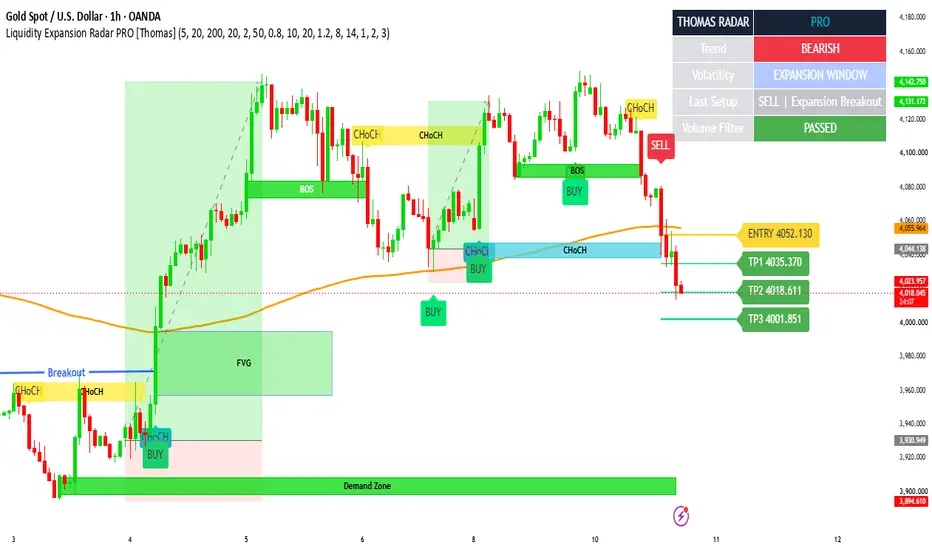
Liquidity Expansion Radar PRO [Thomas ] is a technical analysis indicator designed to help traders study market volatility, liquidity movements, breakout opportunities, and potential reversal conditions. It combines volatility compression, expansion breakout detection, liquidity sweep analysis, market structure, EMA trend filtering, optional volume confirmation, and ATR-based target projections into one organized chart tool. The indicator is designed for traders who prefer a clean chart environment with selective signals and structured market analysis. It can be used on instruments such as Gold (XAUUSD) and Bitcoin (BTCUSD), as well as other liquid markets.
1: How the Indicator Works
The indicator focuses on two main trading conditions: Expansion Breakout and Liquidity Sweep Reversal. Both setups use price action and configurable confirmation filters to identify potential opportunities. The purpose is to help traders understand when the market may be preparing for a directional move or when price may be rejecting an important swing level.
2: Volatility Compression and Expansion Breakout
Markets often move through periods of relatively low volatility before experiencing stronger price movement. This indicator uses Bollinger Band width to identify potential compression conditions. When the band width becomes narrower than its calculated average threshold, the market is classified as being in compression. If price subsequently closes above the previous range high with a bullish candle, a potential bullish expansion breakout is identified. Similarly, when price closes below the previous range low with a bearish candle, a potential bearish expansion breakout is identified. The recent squeeze setting determines how many bars after compression a breakout can qualify.
3: Liquidity Sweep Reversal
The liquidity sweep logic tracks previously identified swing highs and swing lows. A bullish liquidity sweep is detected when price moves below a previous swing low and then closes back above that level with a bullish candle. A bearish liquidity sweep is detected when price moves above a previous swing high and then closes back below that level with a bearish candle. These conditions may indicate rejection of an important price level and a possible change in short-term direction. However, a liquidity sweep alone does not confirm a reversal, so traders should also consider market structure and broader price action.
4: BOS and CHoCH

The indicator includes swing-based market structure references. BOS, or Break of Structure, is identified when price breaks above the latest tracked swing high or below the latest tracked swing low. CHoCH, or Change of Character, is identified when a structural break occurs in the opposite direction to the previously detected structure trend. These labels help traders observe potential changes in market behaviour and structure. They are based on the indicator's swing-break logic and should not be interpreted as definitive institutional order-flow confirmation.
5: EMA Trend Filter

The EMA trend filter helps traders assess directional market conditions. When the filter is enabled, bullish setups require price to be above the selected EMA, while bearish setups require price to be below it. The default EMA length is 200, but traders can adjust it according to their analysis preferences. This filter is intended to reduce signals that move against the selected trend direction. It may also delay some signals or exclude opportunities during rapid market changes.
6: Volume Confirmation
An optional volume filter is available for traders who want additional confirmation. When enabled, the indicator compares current volume with its moving average. A setup passes this filter when current volume exceeds the selected relative volume threshold. The default volume average length is 20, and the default relative volume multiplier is 1.2. Volume confirmation is disabled by default, allowing traders to decide whether this additional condition is suitable for their market and data feed.
7: Entry and ATR-Based Targets

When a confirmed BUY or SELL signal appears, the indicator calculates the entry reference using the signal candle's closing price. It then projects three target levels using the Average True Range. For a BUY setup, TP1, TP2, and TP3 are projected above the entry price. For a SELL setup, they are projected below the entry price. The default target multipliers are 1.0 ATR for TP1, 2.0 ATR for TP2, and 3.0 ATR for TP3, with an ATR length of 14. These projections adapt to current market volatility and are intended as analytical reference levels. They are not guaranteed price destinations or guaranteed profits. The indicator displays the latest setup's entry and target levels to help maintain a cleaner chart.
8: Dashboard

The dashboard provides a quick overview of the indicator's readings. The Trend section displays whether price is above or below the selected EMA. The Volatility section shows whether the market is currently in compression, within a recent expansion window, or in normal conditions. The Last Setup section displays the direction and type of the most recent signal. The Volume Filter section shows whether the volume condition has passed or is waiting. This information is intended to make the indicator's current conditions easier to review without adding excessive chart markings.
9: Complete Settings and Customization

The Main Settings section allows traders to adjust Swing Length, Breakout Range, Trend EMA, and the EMA trend filter. Swing Length controls the sensitivity of swing detection, while Breakout Range defines the previous high-low range used for breakout calculations. The default swing length is 5, breakout range is 20, and trend EMA is 200.
The Expansion Settings section includes Bollinger Length, Bollinger Multiplier, Squeeze Average Length, Squeeze Sensitivity, and Recent Squeeze Bars. These settings control how volatility compression is identified and how long after a compression condition a breakout can qualify. The default Bollinger length is 20, multiplier is 2.0, squeeze average length is 50, squeeze sensitivity is 0.80, and recent squeeze window is 10 bars.
The Confirmation Filters section includes the option to enable volume confirmation, Volume Average Length, Minimum Relative Volume, and Signal Cooldown. The default volume average length is 20, relative volume multiplier is 1.2, and signal cooldown is 8 bars. The cooldown setting helps control how frequently new signals can appear.
The Target Settings section allows traders to adjust ATR Length and the three target multipliers. The default ATR length is 14, with TP1 at 1.0 ATR, TP2 at 2.0 ATR, and TP3 at 3.0 ATR.
The Visual Settings section allows traders to show or hide the Trend EMA, BOS and CHoCH labels, dashboard, and Entry and Target levels. These options make it possible to adjust the chart display according to individual preferences.
10: How to Use the Indicator
First, add Thomas | Liquidity Expansion Radar PRO to your chart and select the instrument and timeframe you want to analyze. Review the EMA direction and dashboard conditions before looking for a setup. Observe whether the market is experiencing volatility compression or has recently moved out of compression. Next, watch for a confirmed breakout or liquidity sweep condition. BOS and CHoCH labels can provide additional market structure context. If a BUY or SELL signal appears, review the entry reference and ATR-based target projections alongside higher-timeframe direction, support and resistance, and other relevant market conditions. Always make an independent trading decision rather than relying on a single indicator signal.
11: Alerts and Notifications
The indicator includes alert conditions for bullish and bearish setups, bullish and bearish liquidity sweeps, bullish and bearish expansion breakouts, and bullish and bearish CHoCH events. To create an alert, add the indicator to your chart, open the TradingView Alert window, select Thomas | Liquidity Expansion Radar PRO as the condition, choose the event you want to monitor, configure your preferred notification method, and create the alert.
12: Important Limitations and Risk Disclaimer
Liquidity Expansion Radar PRO [Thomas ] is a technical analysis tool intended for educational and analytical purposes. It does not provide financial advice, execute trades, or guarantee trading results. Breakouts can fail, liquidity sweeps do not always lead to reversals, and market conditions can change quickly. Volume data may vary between symbols and brokers, while EMA filtering can delay or exclude certain signals. ATR-based targets are estimates based on recent volatility and may not be reached. The displayed entry is calculated from the signal candle's close, and actual execution prices may differ. This version does not calculate or display a stop-loss, so traders must independently define their risk limits and position sizing. Historical signals and indicator conditions do not guarantee future performance. Testing on historical data and a paper-trading account is recommended before considering live use.
13: ⚠️ IMPORTANT NOTE – MANUAL CHART ELEMENTS

Please note that certain elements displayed on the chart are manually added for technical analysis purposes and are NOT part of the indicator's automated features.
Manual Targets: All target levels and price projections are manually drawn and are not generated by the indicator.
Demand Zone: The green Demand Zone displayed below the price action is manually marked.
Breakout: The blue Breakout line and its label are manually added.
Manual Analysis: Any additional zones, levels, arrows, or chart markings are manually drawn.
Liquidity Expansion Radar PRO [Thomas ] is a technical analysis indicator designed to help traders study market volatility, liquidity movements, breakout opportunities, and potential reversal conditions. It combines volatility compression, expansion breakout detection, liquidity sweep analysis, market structure, EMA trend filtering, optional volume confirmation, and ATR-based target projections into one organized chart tool. The indicator is designed for traders who prefer a clean chart environment with selective signals and structured market analysis. It can be used on instruments such as Gold (XAUUSD) and Bitcoin (BTCUSD), as well as other liquid markets.
1: How the Indicator Works
The indicator focuses on two main trading conditions: Expansion Breakout and Liquidity Sweep Reversal. Both setups use price action and configurable confirmation filters to identify potential opportunities. The purpose is to help traders understand when the market may be preparing for a directional move or when price may be rejecting an important swing level.
2: Volatility Compression and Expansion Breakout
Markets often move through periods of relatively low volatility before experiencing stronger price movement. This indicator uses Bollinger Band width to identify potential compression conditions. When the band width becomes narrower than its calculated average threshold, the market is classified as being in compression. If price subsequently closes above the previous range high with a bullish candle, a potential bullish expansion breakout is identified. Similarly, when price closes below the previous range low with a bearish candle, a potential bearish expansion breakout is identified. The recent squeeze setting determines how many bars after compression a breakout can qualify.
3: Liquidity Sweep Reversal
The liquidity sweep logic tracks previously identified swing highs and swing lows. A bullish liquidity sweep is detected when price moves below a previous swing low and then closes back above that level with a bullish candle. A bearish liquidity sweep is detected when price moves above a previous swing high and then closes back below that level with a bearish candle. These conditions may indicate rejection of an important price level and a possible change in short-term direction. However, a liquidity sweep alone does not confirm a reversal, so traders should also consider market structure and broader price action.
4: BOS and CHoCH
The indicator includes swing-based market structure references. BOS, or Break of Structure, is identified when price breaks above the latest tracked swing high or below the latest tracked swing low. CHoCH, or Change of Character, is identified when a structural break occurs in the opposite direction to the previously detected structure trend. These labels help traders observe potential changes in market behaviour and structure. They are based on the indicator's swing-break logic and should not be interpreted as definitive institutional order-flow confirmation.
5: EMA Trend Filter
The EMA trend filter helps traders assess directional market conditions. When the filter is enabled, bullish setups require price to be above the selected EMA, while bearish setups require price to be below it. The default EMA length is 200, but traders can adjust it according to their analysis preferences. This filter is intended to reduce signals that move against the selected trend direction. It may also delay some signals or exclude opportunities during rapid market changes.
6: Volume Confirmation
An optional volume filter is available for traders who want additional confirmation. When enabled, the indicator compares current volume with its moving average. A setup passes this filter when current volume exceeds the selected relative volume threshold. The default volume average length is 20, and the default relative volume multiplier is 1.2. Volume confirmation is disabled by default, allowing traders to decide whether this additional condition is suitable for their market and data feed.
7: Entry and ATR-Based Targets
When a confirmed BUY or SELL signal appears, the indicator calculates the entry reference using the signal candle's closing price. It then projects three target levels using the Average True Range. For a BUY setup, TP1, TP2, and TP3 are projected above the entry price. For a SELL setup, they are projected below the entry price. The default target multipliers are 1.0 ATR for TP1, 2.0 ATR for TP2, and 3.0 ATR for TP3, with an ATR length of 14. These projections adapt to current market volatility and are intended as analytical reference levels. They are not guaranteed price destinations or guaranteed profits. The indicator displays the latest setup's entry and target levels to help maintain a cleaner chart.
8: Dashboard
The dashboard provides a quick overview of the indicator's readings. The Trend section displays whether price is above or below the selected EMA. The Volatility section shows whether the market is currently in compression, within a recent expansion window, or in normal conditions. The Last Setup section displays the direction and type of the most recent signal. The Volume Filter section shows whether the volume condition has passed or is waiting. This information is intended to make the indicator's current conditions easier to review without adding excessive chart markings.
9: Complete Settings and Customization
The Main Settings section allows traders to adjust Swing Length, Breakout Range, Trend EMA, and the EMA trend filter. Swing Length controls the sensitivity of swing detection, while Breakout Range defines the previous high-low range used for breakout calculations. The default swing length is 5, breakout range is 20, and trend EMA is 200.
The Expansion Settings section includes Bollinger Length, Bollinger Multiplier, Squeeze Average Length, Squeeze Sensitivity, and Recent Squeeze Bars. These settings control how volatility compression is identified and how long after a compression condition a breakout can qualify. The default Bollinger length is 20, multiplier is 2.0, squeeze average length is 50, squeeze sensitivity is 0.80, and recent squeeze window is 10 bars.
The Confirmation Filters section includes the option to enable volume confirmation, Volume Average Length, Minimum Relative Volume, and Signal Cooldown. The default volume average length is 20, relative volume multiplier is 1.2, and signal cooldown is 8 bars. The cooldown setting helps control how frequently new signals can appear.
The Target Settings section allows traders to adjust ATR Length and the three target multipliers. The default ATR length is 14, with TP1 at 1.0 ATR, TP2 at 2.0 ATR, and TP3 at 3.0 ATR.
The Visual Settings section allows traders to show or hide the Trend EMA, BOS and CHoCH labels, dashboard, and Entry and Target levels. These options make it possible to adjust the chart display according to individual preferences.
10: How to Use the Indicator
First, add Thomas | Liquidity Expansion Radar PRO to your chart and select the instrument and timeframe you want to analyze. Review the EMA direction and dashboard conditions before looking for a setup. Observe whether the market is experiencing volatility compression or has recently moved out of compression. Next, watch for a confirmed breakout or liquidity sweep condition. BOS and CHoCH labels can provide additional market structure context. If a BUY or SELL signal appears, review the entry reference and ATR-based target projections alongside higher-timeframe direction, support and resistance, and other relevant market conditions. Always make an independent trading decision rather than relying on a single indicator signal.
11: Alerts and Notifications
The indicator includes alert conditions for bullish and bearish setups, bullish and bearish liquidity sweeps, bullish and bearish expansion breakouts, and bullish and bearish CHoCH events. To create an alert, add the indicator to your chart, open the TradingView Alert window, select Thomas | Liquidity Expansion Radar PRO as the condition, choose the event you want to monitor, configure your preferred notification method, and create the alert.
12: Important Limitations and Risk Disclaimer
Liquidity Expansion Radar PRO [Thomas ] is a technical analysis tool intended for educational and analytical purposes. It does not provide financial advice, execute trades, or guarantee trading results. Breakouts can fail, liquidity sweeps do not always lead to reversals, and market conditions can change quickly. Volume data may vary between symbols and brokers, while EMA filtering can delay or exclude certain signals. ATR-based targets are estimates based on recent volatility and may not be reached. The displayed entry is calculated from the signal candle's close, and actual execution prices may differ. This version does not calculate or display a stop-loss, so traders must independently define their risk limits and position sizing. Historical signals and indicator conditions do not guarantee future performance. Testing on historical data and a paper-trading account is recommended before considering live use.
13: ⚠️ IMPORTANT NOTE – MANUAL CHART ELEMENTS
Please note that certain elements displayed on the chart are manually added for technical analysis purposes and are NOT part of the indicator's automated features.
Manual Targets: All target levels and price projections are manually drawn and are not generated by the indicator.
Demand Zone: The green Demand Zone displayed below the price action is manually marked.
Breakout: The blue Breakout line and its label are manually added.
Manual Analysis: Any additional zones, levels, arrows, or chart markings are manually drawn.

Join telegram for free gold btcusd and usoil signals
t.me/+viyq6E0EBl82MmY8
t.me/+viyq6E0EBl82MmY8
Haftungsausschluss
Die Informationen und Veröffentlichungen sind nicht als Finanz-, Anlage-, Handels- oder andere Arten von Ratschlägen oder Empfehlungen gedacht, die von TradingView bereitgestellt oder gebilligt werden, und stellen diese nicht dar. Lesen Sie mehr in den Nutzungsbedingungen.
Join telegram for free gold btcusd and usoil signals
t.me/+viyq6E0EBl82MmY8
t.me/+viyq6E0EBl82MmY8
Haftungsausschluss
Die Informationen und Veröffentlichungen sind nicht als Finanz-, Anlage-, Handels- oder andere Arten von Ratschlägen oder Empfehlungen gedacht, die von TradingView bereitgestellt oder gebilligt werden, und stellen diese nicht dar. Lesen Sie mehr in den Nutzungsbedingungen.