OPEN-SOURCE SCRIPT
Gann Time Price Geometry Ver 1.0
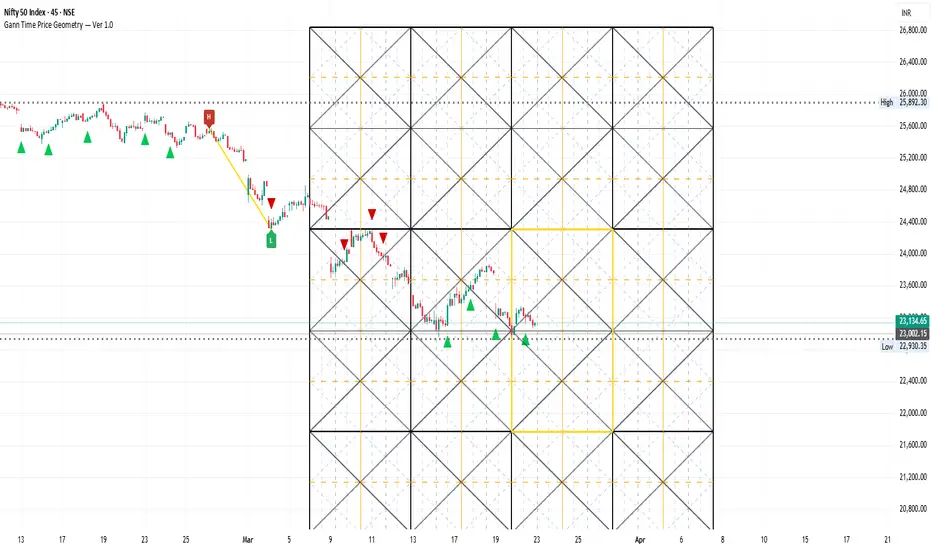
Gann Time Price Geometry — Ver 1.0
This indicator builds a dynamic Gann Square grid directly on your chart, anchored to automatically detected swing highs and lows. It combines classical Gann geometry with a scoring-based signal engine to highlight high-confluence buy and sell opportunities.
How it works
The script uses a Vector Circle Search to find the best pivot pair within a harmonic window around your chosen Gann number (88 bars by default). It scores each candidate swing by how closely its price-per-bar ratio and duration match the ideal Gann proportion, then anchors the full grid to the winning pair.
What you get on the chart
What is Drawn on the Chart
🔲 Full Square
The outer Gann Square spans your chosen Gann number in bars horizontally, and 2× the detected swing range vertically. This is the master structure everything else is built inside.
🔲 Sub-Squares (4 Inner Cells)
The full square is divided into 4 equal inner cells — 2 columns × 2 rows. Each cell gets its own set of angle lines projected from its corners. This creates nested geometry that gives you finer entry and exit precision within the larger structure.
📐 Angle Lines
1x1 — the true balance angle between price and time, projected from all four corners of both the full square and each sub-cell
2x1 / 1x2 — steeper and shallower angles showing acceleration and deceleration zones
All angles are clamped within their respective square boundaries so the chart stays clean
⏱️ Time Cycle Verticals
Vertical lines mark Gann's 1/8 harmonic divisions of time across the square:
1/2 cycle (orange, prominent) — the most powerful time node, midpoint of the square
1/4 and 3/4 cycles (dashed) — secondary time divisions where reactions are common
1/8 minor cycles (optional) — finer subdivisions for short-term timing
When price reaches an angle line and a time cycle vertical at the same bar — that is a Gann confluence point, and where this indicator focuses its signals.
Signal scoring (max ~10 pts per signal)
Set Min Confluence Score to 3–4 for quality signals. Lower it to 0 to see all geometrically valid touches.
Settings to tune first
Match Gann Number to your timeframe (88 for most, 44 for fast charts)
Check the Info Table — if Swing pts/bar doesn't match Diagonal, update the Swing Diagonal Is dropdown
Adjust Period Divisor to the harmonic you are trading (1/2 suits swing traders)
Alerts included — Gann Buy and Gann Sell, fire on bar close.
First-Time Setup — 3 Steps
Step 1 — Choose your Gann Number
Start with 88 on Daily or 4H charts. Use 44 on 1H or faster. This defines the width of your square in bars.
Step 2 — Match the Diagonal
Open the chart, look at the Info Table. Find Swing pts/bar and the suggest note next to it. If it says "use 2x1", set the Swing Diagonal Is dropdown to 2x1. Green ✅ means you are calibrated correctly.
Step 3 — Set your Confluence Level
Start at 3. If you are getting too many signals, raise it to 4 or 5. If you want to study all geometric touches without filtering, set it to 0.
Works on: Any instrument — stocks, crypto, forex, indices, commodities
Works on: Any timeframe — tune Gann Number to match
Alerts: Gann Buy and Gann Sell included, fire on bar close
Note on Line Limits
TradingView Pine Script has a 500-line limit. Keep Squares Forward and Squares Backward at 2 or below to stay within this limit. The indicator will silently drop lines if the limit is exceeded.
This indicator builds a dynamic Gann Square grid directly on your chart, anchored to automatically detected swing highs and lows. It combines classical Gann geometry with a scoring-based signal engine to highlight high-confluence buy and sell opportunities.
How it works
The script uses a Vector Circle Search to find the best pivot pair within a harmonic window around your chosen Gann number (88 bars by default). It scores each candidate swing by how closely its price-per-bar ratio and duration match the ideal Gann proportion, then anchors the full grid to the winning pair.
What you get on the chart
What is Drawn on the Chart
🔲 Full Square
The outer Gann Square spans your chosen Gann number in bars horizontally, and 2× the detected swing range vertically. This is the master structure everything else is built inside.
🔲 Sub-Squares (4 Inner Cells)
The full square is divided into 4 equal inner cells — 2 columns × 2 rows. Each cell gets its own set of angle lines projected from its corners. This creates nested geometry that gives you finer entry and exit precision within the larger structure.
📐 Angle Lines
1x1 — the true balance angle between price and time, projected from all four corners of both the full square and each sub-cell
2x1 / 1x2 — steeper and shallower angles showing acceleration and deceleration zones
All angles are clamped within their respective square boundaries so the chart stays clean
⏱️ Time Cycle Verticals
Vertical lines mark Gann's 1/8 harmonic divisions of time across the square:
1/2 cycle (orange, prominent) — the most powerful time node, midpoint of the square
1/4 and 3/4 cycles (dashed) — secondary time divisions where reactions are common
1/8 minor cycles (optional) — finer subdivisions for short-term timing
When price reaches an angle line and a time cycle vertical at the same bar — that is a Gann confluence point, and where this indicator focuses its signals.
Signal scoring (max ~10 pts per signal)
Set Min Confluence Score to 3–4 for quality signals. Lower it to 0 to see all geometrically valid touches.
Settings to tune first
Match Gann Number to your timeframe (88 for most, 44 for fast charts)
Check the Info Table — if Swing pts/bar doesn't match Diagonal, update the Swing Diagonal Is dropdown
Adjust Period Divisor to the harmonic you are trading (1/2 suits swing traders)
Alerts included — Gann Buy and Gann Sell, fire on bar close.
First-Time Setup — 3 Steps
Step 1 — Choose your Gann Number
Start with 88 on Daily or 4H charts. Use 44 on 1H or faster. This defines the width of your square in bars.
Step 2 — Match the Diagonal
Open the chart, look at the Info Table. Find Swing pts/bar and the suggest note next to it. If it says "use 2x1", set the Swing Diagonal Is dropdown to 2x1. Green ✅ means you are calibrated correctly.
Step 3 — Set your Confluence Level
Start at 3. If you are getting too many signals, raise it to 4 or 5. If you want to study all geometric touches without filtering, set it to 0.
Works on: Any instrument — stocks, crypto, forex, indices, commodities
Works on: Any timeframe — tune Gann Number to match
Alerts: Gann Buy and Gann Sell included, fire on bar close
Note on Line Limits
TradingView Pine Script has a 500-line limit. Keep Squares Forward and Squares Backward at 2 or below to stay within this limit. The indicator will silently drop lines if the limit is exceeded.
Open-source Skript
Ganz im Sinne von TradingView hat dieser Autor sein/ihr Script als Open-Source veröffentlicht. Auf diese Weise können nun auch andere Trader das Script rezensieren und die Funktionalität überprüfen. Vielen Dank an den Autor! Sie können das Script kostenlos verwenden, aber eine Wiederveröffentlichung des Codes unterliegt unseren Hausregeln.

Haftungsausschluss
Die Informationen und Veröffentlichungen sind nicht als Finanz-, Anlage-, Handels- oder andere Arten von Ratschlägen oder Empfehlungen gedacht, die von TradingView bereitgestellt oder gebilligt werden, und stellen diese nicht dar. Lesen Sie mehr in den Nutzungsbedingungen.
Open-source Skript
Ganz im Sinne von TradingView hat dieser Autor sein/ihr Script als Open-Source veröffentlicht. Auf diese Weise können nun auch andere Trader das Script rezensieren und die Funktionalität überprüfen. Vielen Dank an den Autor! Sie können das Script kostenlos verwenden, aber eine Wiederveröffentlichung des Codes unterliegt unseren Hausregeln.
Haftungsausschluss
Die Informationen und Veröffentlichungen sind nicht als Finanz-, Anlage-, Handels- oder andere Arten von Ratschlägen oder Empfehlungen gedacht, die von TradingView bereitgestellt oder gebilligt werden, und stellen diese nicht dar. Lesen Sie mehr in den Nutzungsbedingungen.