OPEN-SOURCE SCRIPT
Aktualisiert Midniteblade 20 DEMA Indicator
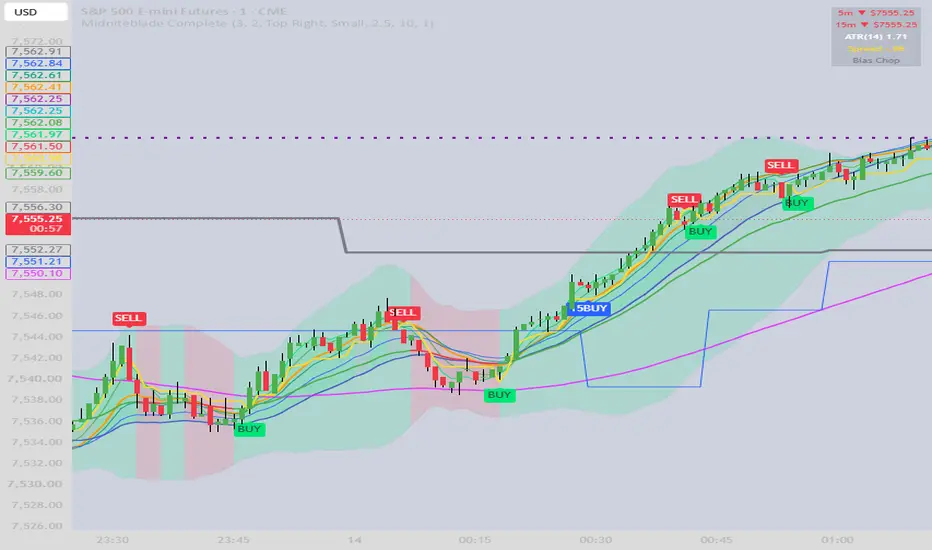
BUY setup
20 DEMA is rising.
Price has closed above the DEMA for at least 3 consecutive bars.
Price pulls back and touches or slightly penetrates the DEMA.
A bullish engulfing candle forms during the pullback.
The engulfing candle closes back above the DEMA.
Volume is above the 20-bar average (optional).
Candle body is at least X ATR (optional).
Generate exactly one BUY signal for that pullback.
No new BUY signal until price makes a new impulse away from the DEMA.
SELL setup
The exact opposite conditions.
20 DEMA is rising.
Price has closed above the DEMA for at least 3 consecutive bars.
Price pulls back and touches or slightly penetrates the DEMA.
A bullish engulfing candle forms during the pullback.
The engulfing candle closes back above the DEMA.
Volume is above the 20-bar average (optional).
Candle body is at least X ATR (optional).
Generate exactly one BUY signal for that pullback.
No new BUY signal until price makes a new impulse away from the DEMA.
SELL setup
The exact opposite conditions.
Versionshinweise
The workflow is now: the breakout arrow gives you the early heads-up that price is breaking structure in the DEMA's direction, and the original BUY/SELL confirms the move has volume and size behind it. You can enter on the breakout signal and add on the full confirmation, or use the breakout as a scalp and the original as the trend continuation hold.Both new EMAs have show/hide toggles in the indicator settings, and they're slightly thinner than the DEMA so the main ribbon stays prominent. You've now got a clean 20/50/200 EMA stack on a 2-min ES chart — short-term trend, intermediate, and the institutional magnet all in one indicator.
Now your workflow on the 2-min chart is: the breakout arrows give you the fast trigger, the original BUY/SELL confirms with volume + ATR backing, and the 5m DEMA trend label tells you whether you're even allowed to take the trade in the first place. On a 2-min chart fighting against a falling 5m DEMA, the indicator stays silent — that's the filter doing its job.
Versionshinweise
Added color for breakout candles in menuVersionshinweise
RTH Only and 200 EMA Filter are on by default since they align with how I trade. They'll immediately reduce signal noise outside regular hours and keep you on the right side of your anchor level.Volume Filter is off by default — turn it on in settings when you want the extra confirmation. Volume before the cash open can be thin, so you may want to toggle it on session-by-session.
Versionshinweise
Added an ATR filter and MACD Filter. The MACD filter is toggleable via the "use MACD filter" in the indicator settings.Versionshinweise
Added an EMA cloud and 5min multi time frame. The EMA trend ribbon when 150>250, red when flipped - you get the structural bias in a single glance without reading a single number.Versionshinweise
Added better buy sell signal indicator to help out smooth the indicator. I urge to add the Turbo Oscillator which works wonderfully with this indicator.Versionshinweise
Changed the ribbons so they are different than the emas. They where using the same space. Also add the wavetrend indicator, i use the TTM squeeze as well. This indicators make mine so much easier to use. Versionshinweise
Add alerts for sales signals. Each ribbon band period: 8/13/24/34/50.Versionshinweise
Added a 15min Multiframe indicator so you now have both a 5min and 15 min. Added a trailing stop that be the orange line as well. This should complete this indicator for now. Enjoy.Versionshinweise
Added a table with the 5min/15min/ ATR(14) so it be clean and not have the tabs block the view. Also took old cloud out and added an adaptive 24 cloud. This uses a 24 ema plus/minus a standard deviation multiplier, giving you a channel that wraps price tighter. Also it changes color to green for bullish and red for bearish. Versionshinweise
Changed the Name of the Indicator. This should be my final update for now. Versionshinweise
I added a 15min Signal on the 2min chart. This is to add confirmation. The way i use this indicator: First never bid against the direction of the 20 dema. That dema gives you bias. So we like for the 20 dema to almost hug the 200 dema. Get close to each other especially during accumulation stage. Then the 20 dema and cloud will move away from the 200. If you get both a signal from the 2m chart and the 15m chart close to each other the 15m signal is a confirmation. If you use this indicator in the 15m chart it is more accurate, but less chances of bidding. So you can have another form of confirmation with 2 signals. Remember you want to wait till the 20 and 200 are close to each other and especially an engulfing candle forms is the best, if not follow the 20 dema and cloud away from the 200. Remember also AMD= Accumulation/Manipulation/Distribution it doesnt always appear but most of the time it does. Think of it as lightning bolt. When you get distribution lets say bearish, the lightning bold starts to form, then it will bounce back then continue. This cycle happens quite regularly. Remember this is a tool to guide: This indicator is for informational purposes only. Investing involves risk of loss. Always consult a licensed professional before making investment decisions. Versionshinweise
Added a Multiplier input to the ema 24 adaptive cloud since it was capturing 99% of price movement in a normal distribution, which is wide. In choppy conditions the cloud balloons and the fill becomes less useful. This should help.Versionshinweise
Ribbon expansion alert Added to the script. Two new inputs in Settings:Show Ribbon Expansion Alert (on/off)
Ribbon Expansion Threshold (default 2.0 pts)
The info table now has a 4th row showing the current Spread value. When the ribbon is compressed within your threshold, it shows yellow. When it expands beyond, it flips green (bullish) or red (bearish).
To create the actual alert: right-click the indicator → Add Alert → condition "Midniteblade Complete" → choose "Ribbon Expansion — Bullish" or "Ribbon Expansion — Bearish".
Versionshinweise
#1 — Bias row (new row 5 in the info table, below Spread)Bullish (green) — ribbon stacked long + price above DEMA 200
Bearish (red) — ribbon stacked short + price below DEMA 200
Mixed ↑ (yellow) — ribbon bullish but price below DEMA 200
Mixed ↓ (yellow) — ribbon bearish but price above DEMA 200
Chop (gray) — ribbon not aligned either way
#2 — 1h DEMA 20 (new toggle, defaults OFF)
Grey dashed line at the 1h DEMA 20 level,
Toggle it on from the indicator settings when you want the higher-timeframe reference
Versionshinweise
Table is in menu to make adjustments there.Open-source Skript
Ganz im Sinne von TradingView hat dieser Autor sein/ihr Script als Open-Source veröffentlicht. Auf diese Weise können nun auch andere Trader das Script rezensieren und die Funktionalität überprüfen. Vielen Dank an den Autor! Sie können das Script kostenlos verwenden, aber eine Wiederveröffentlichung des Codes unterliegt unseren Hausregeln.

Haftungsausschluss
Die Informationen und Veröffentlichungen sind nicht als Finanz-, Anlage-, Handels- oder andere Arten von Ratschlägen oder Empfehlungen gedacht, die von TradingView bereitgestellt oder gebilligt werden, und stellen diese nicht dar. Lesen Sie mehr in den Nutzungsbedingungen.
Open-source Skript
Ganz im Sinne von TradingView hat dieser Autor sein/ihr Script als Open-Source veröffentlicht. Auf diese Weise können nun auch andere Trader das Script rezensieren und die Funktionalität überprüfen. Vielen Dank an den Autor! Sie können das Script kostenlos verwenden, aber eine Wiederveröffentlichung des Codes unterliegt unseren Hausregeln.
Haftungsausschluss
Die Informationen und Veröffentlichungen sind nicht als Finanz-, Anlage-, Handels- oder andere Arten von Ratschlägen oder Empfehlungen gedacht, die von TradingView bereitgestellt oder gebilligt werden, und stellen diese nicht dar. Lesen Sie mehr in den Nutzungsbedingungen.