OPEN-SOURCE SCRIPT
HEENA 12 [CLEVER]
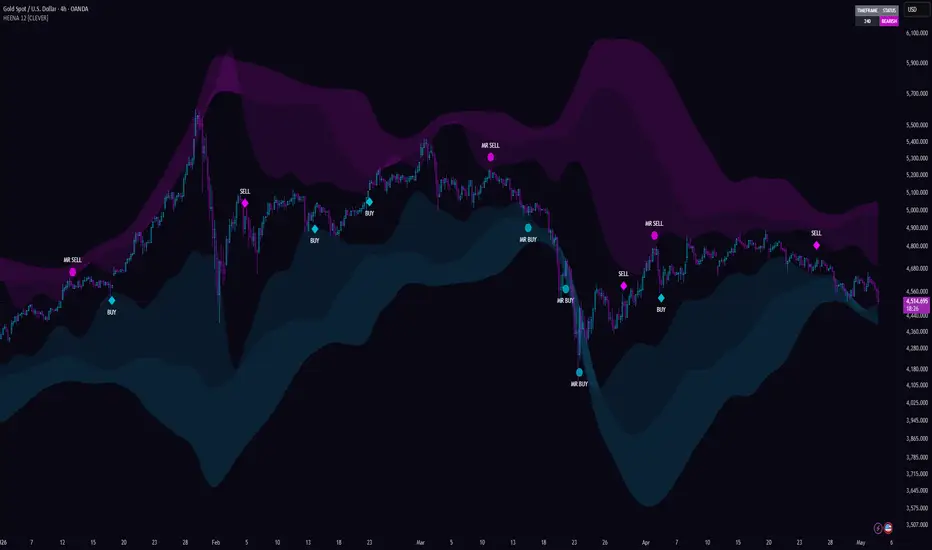
HEENA 12 [CLEVER] — Overview
1. System Philosophy & Design Approach
HEENA 12 is an advanced, rule-based trading indicator designed to analyze market behavior through a structured and multi-layered framework. Instead of relying on a single signal type, it integrates trend-following and mean reversion concepts to provide a more balanced analytical perspective. The system focuses on identifying meaningful market conditions rather than generating constant signals, ensuring that outputs are condition-based and filtered. This approach helps users interpret price action within a broader context, improving clarity and decision support without making exaggerated performance claims.
2. Trend Detection Engine
At its core, the indicator uses a moving average–based trend model enhanced with volatility adjustments through ATR (Average True Range). This creates a more adaptive trend detection mechanism compared to traditional crossover systems. By accounting for market volatility, the trend signals become more stable and less prone to noise or false breakouts. The system is designed to adapt across different market speeds, making it suitable for both slower and more dynamic environments.
3. Entry Logic & Retest Structure
Rather than triggering entries on immediate breakouts, HEENA 12 applies a retest-based logic. This means signals are generated when price pulls back toward a key level and then resumes movement in the direction of the trend. Such an approach emphasizes timing and structure, aiming to reduce impulsive entries and improve the quality of signal conditions. This design aligns with common market behavior where trends often include retracements before continuation.
4. Advanced Filtering Mechanisms
A key strength of the system lies in its filtering capabilities. It incorporates a volatility filter to reduce signals during low-activity or sideways market conditions. Additionally, an adaptive cooldown mechanism dynamically adjusts signal frequency based on current volatility levels, making the system more responsive in active markets and more selective in slower conditions. A smart filtering layer further limits signal repetition within the same trend phase, helping maintain a cleaner and more focused chart environment.
5. Bands & Price Structure Analysis
The indicator includes an enhanced band system inspired by Bollinger Bands, combined with smoothing techniques to improve visual clarity. These bands are not purely decorative; they act as structural zones that help validate signal conditions. Signals are more likely to appear when price interacts with these zones in a meaningful way. Alongside this, mean reversion signals are included to highlight situations where price returns from extreme levels back toward equilibrium, offering additional analytical insight.
6. Performance Optimization & Transparency
HEENA 12 incorporates optimization features such as a lite mode to reduce computational load and improve performance on different systems. It is designed to operate as a non-repainting tool on confirmed candles, ensuring signal stability after candle closure. An optional smoothing feature is available, with clear disclosure that it may adjust historical values for visualization purposes. This transparency aligns with platform guidelines and supports realistic user expectations.
7. Overall Purpose & Use Case
Overall, HEENA 12 functions as a comprehensive analytical tool intended to support structured decision-making. Its primary goal is not to guarantee outcomes but to enhance market interpretation through improved timing, filtered signals, and contextual awareness. By combining multiple analytical layers into a single system, it provides users with a clearer and more disciplined framework for evaluating price action.
Core Concept
1. Multi-Layered Market Interpretation
The core concept of HEENA 12 is built around understanding the market as a combination of trend, volatility, and price behavior rather than relying on a single indicator signal. It does not treat price movement as random; instead, it assumes that markets move in structured phases—trending, retracing, and consolidating. By combining multiple analytical layers, the system aims to provide a clearer interpretation of these phases. This layered approach helps reduce dependency on isolated signals and encourages a more context-driven view of market conditions.
2. Adaptive Trend Framework
At the heart of the system lies an adaptive trend model that blends moving averages with volatility measurements. Instead of using static trend definitions, the indicator adjusts its behavior based on how active or quiet the market is. This allows it to better align with real-time conditions, where price movement is rarely uniform. The goal of this framework is to identify directional bias while minimizing sensitivity to short-term noise, thereby supporting a more stable analytical foundation.
3. Structured Entry Philosophy
A key principle behind HEENA 12 is that meaningful opportunities often occur during retracements within a broader trend rather than at initial breakouts. The system reflects this by focusing on retest-based conditions, where price temporarily moves against the prevailing direction before continuing. This concept is rooted in the idea that markets tend to revisit important levels before making sustained moves. By emphasizing structure over immediacy, the indicator promotes a more measured approach to interpreting potential setups.
4. Signal Quality Over Quantity
Another fundamental concept is prioritizing signal quality instead of frequency. The system incorporates multiple filters designed to limit signals during unclear or low-activity conditions. These filters consider volatility levels, trend consistency, and recent signal history to avoid repetitive or low-confidence outputs. This reflects the broader philosophy that fewer, more refined signals can provide better analytical value than constant, unfiltered activity.
5. Price Extremes & Mean Reversion Awareness
In addition to trend continuation, the indicator acknowledges that markets can temporarily move away from equilibrium and then revert back. This is addressed through its band-based structure, which highlights relative price extremes. When price extends beyond typical ranges and begins to return, it can indicate a shift in short-term behavior. By incorporating both continuation and reversion perspectives, the system offers a more comprehensive understanding of how price interacts with its surrounding environment.
6. Context-Driven Decision Support
HEENA 12 is designed to assist in decision-making rather than automate it. Its outputs are intended to be interpreted within the broader market context, including timeframe selection, volatility conditions, and overall structure. The system does not assume that any single signal guarantees an outcome; instead, it provides structured information to support more informed analysis. This aligns with responsible usage practices and emphasizes the importance of user discretion.
7. Transparency & Responsible Design
A defining aspect of the core concept is transparency in how the indicator behaves. It clearly distinguishes between stable signals (based on confirmed data) and optional visual enhancements that may adjust historical values. This ensures that users understand the difference between analytical output and visual smoothing. By maintaining clarity and avoiding exaggerated claims, the system adheres to platform guidelines and promotes realistic expectations.
Final Perspective
At its core, HEENA 12 is not just a signal generator but a structured analytical framework. It combines trend identification, volatility adaptation, and price structure awareness into a unified system aimed at improving how market behavior is interpreted. Its primary value lies in organizing complex market information into a more understandable form, supporting disciplined and context-aware analysis.
Key Features
1. Adaptive Trend Detection Engine
HEENA 12 uses a dynamic trend detection model based on moving averages combined with volatility measurements. Instead of relying on fixed conditions, the system adjusts its interpretation of trend strength according to market activity. This allows it to remain stable during normal fluctuations while still responding to meaningful directional changes. The objective is to provide a clearer sense of market bias without overreacting to short-term noise.
2. Retest-Based Signal Logic
A central feature of the system is its focus on retest conditions rather than immediate breakouts. Signals are generated when price revisits a key level and shows signs of continuing in the prevailing direction. This approach reflects common market behavior where price often retraces before moving further. By emphasizing structure, the system aims to highlight more contextually relevant situations rather than frequent but less refined signals.
3. Volatility-Aware Filtering System
The indicator incorporates a volatility filter to manage signal quality across different market conditions. During periods of low activity or consolidation, signals are reduced to avoid noise. In more active environments, the system becomes more responsive. This helps maintain consistency in how signals are interpreted, ensuring that outputs are better aligned with the current market environment.
4. Adaptive Cooldown Mechanism
To prevent excessive signal generation, HEENA 12 includes a cooldown feature that dynamically adjusts based on volatility levels. When the market is moving quickly, the system allows signals to appear more frequently. In slower conditions, it increases the spacing between signals. This adaptive behavior supports a more balanced flow of information and reduces unnecessary repetition.
5. Smart Signal Limitation (Trend-Based Filtering)
The system introduces a smart filtering layer that limits signal repetition within the same trend phase. Once a valid signal has been identified, additional signals in the same direction are restricted unless conditions meaningfully change. This helps keep the chart clean and encourages focus on higher-quality setups rather than continuous entries in the same trend.
6. Enhanced Band Structure with Smoothing
HEENA 12 features a band-based structure inspired by traditional volatility bands, enhanced with smoothing techniques for improved clarity. These bands act as reference zones that help contextualize price movement. Rather than serving only as a visual guide, they play a role in validating signal conditions, ensuring that price is interacting with meaningful areas before a signal is considered.
7. Mean Reversion Awareness
In addition to trend continuation, the system includes a mechanism to highlight situations where price moves away from its typical range and begins to return. This provides insight into short-term shifts in behavior and complements the trend-based approach. By including both continuation and reversion perspectives, the indicator supports a more complete view of market dynamics.
8. Configurable Inputs & User Control
The indicator offers a range of customizable settings, allowing users to adjust parameters such as smoothing intensity, signal filtering behavior, and visual preferences. This flexibility makes it adaptable to different trading styles and timeframes, while still maintaining its core analytical structure.
9. Performance Optimization (Lite Mode)
To ensure smooth operation across different environments, HEENA 12 includes an optional lite mode that reduces computational load. This is particularly useful when working with complex calculations or extended historical data, allowing users to maintain performance without significantly altering the analytical output.
10. Non-Repainting Signal Behavior (with Transparency)
Signals are designed to remain stable once a candle is confirmed, supporting consistent analysis. At the same time, the system provides an optional smoothing feature with clear disclosure that it may adjust historical values for visualization purposes. This transparency helps users distinguish between analytical signals and visual enhancements, aligning with responsible usage practices.
Final Perspective
The key features of HEENA 12 are built around one principle: delivering structured, context-aware insights rather than constant signal output. By combining adaptive trend logic, volatility-aware filtering, and price structure analysis, the system provides a refined analytical tool that supports disciplined and informed market evaluation.
How to Use (Deep & Structured Guide)
1. Understanding the Indicator’s Role
HEENA 12 is designed as a decision-support tool, not an automated trading system. Its purpose is to help interpret market structure by combining trend direction, volatility conditions, and price positioning. Before using it, it is important to approach the signals as analytical guidance rather than fixed instructions. The indicator works best when used alongside basic chart reading, such as identifying key levels and overall market context.
2. Identifying Market Direction (First Step)
Start by observing the trend direction shown by the indicator. The color shifts and overall signal bias help indicate whether the market is leaning bullish or bearish. Instead of reacting immediately, use this information to form a directional bias. For example, if the system reflects an upward trend, focus more on buy-side conditions and avoid forcing trades against that direction unless there is a strong contextual reason.
3. Using Retest Signals for Contextual Entries
The primary signals are based on retest behavior, meaning price revisits a level before continuing in the trend direction. When a signal appears, it represents a moment where price structure aligns with the identified trend. Rather than acting instantly, it is more effective to observe how price behaves around that signal area—such as whether it holds above or below nearby levels. This adds confirmation and improves interpretation.
4. Applying the Band Structure for Validation
The band system provides a visual framework for understanding where price is positioned relative to its typical range. When price is within the bands, it often reflects normal conditions, while movement toward the outer areas may indicate stronger momentum or temporary extremes. Use this structure to validate whether a signal is occurring in a logical zone rather than in an overextended or unclear area.
5. Interpreting Mean Reversion Signals
Mean reversion signals highlight situations where price moves away from its usual range and then begins to return. These signals can indicate short-term changes in behavior but should be interpreted carefully. They are most useful when considered alongside the broader trend, as they may represent temporary pullbacks rather than full reversals. Combining this insight with overall market direction helps avoid misinterpretation.
6. Leveraging Filters for Better Clarity
HEENA 12 includes built-in filters that automatically reduce signals during low-volatility or sideways conditions. When signals are less frequent, it often indicates that the market lacks clear direction. Instead of forcing trades during these periods, it is generally more effective to wait for conditions where the indicator becomes more active again. This helps maintain a disciplined and patient approach.
7. Managing Signal Frequency with Cooldown Logic
The adaptive cooldown feature controls how often signals appear based on market activity. In fast-moving conditions, signals may appear closer together, while in slower environments, they are spaced further apart. This behavior helps maintain balance and prevents over-reliance on repetitive signals. Users should respect this spacing rather than trying to anticipate or override it.
8. Adjusting Settings Based on Preference
The indicator provides several customizable options, such as smoothing levels, filter sensitivity, and performance modes. Users can adjust these settings to better match their preferred timeframe or chart style. However, it is recommended to make gradual changes and observe how they affect the indicator’s behavior, rather than making multiple adjustments at once.
9. Using the Dashboard for Quick Reference
The built-in dashboard offers a quick view of the current trend status for the selected timeframe. This can be used as a reference point when analyzing the chart, helping to confirm whether current signals align with the broader direction. It serves as a summary tool rather than a standalone decision-maker.
10. Maintaining a Responsible Approach
HEENA 12 is most effective when used with a structured and disciplined mindset. Signals should be interpreted within the context of overall market conditions, and no single output should be treated as a guaranteed outcome. The indicator is designed to enhance clarity and support analysis, not to replace judgment. Maintaining realistic expectations and combining it with sound risk management practices is essential.
Final Perspective
Using HEENA 12 effectively involves more than reacting to signals—it requires understanding how its components interact. By combining trend awareness, structured entry conditions, and volatility-based filtering, the indicator provides a refined framework for analyzing price behavior. When used thoughtfully, it can improve consistency and clarity in market evaluation while remaining aligned with responsible trading practices.
How It Works (Deep Internal Logic Overview)
1. Market Data Processing Layer (Foundation)
HEENA 12 starts by taking raw price data (open, high, low, close) and converting it into structured analytical values. It applies multiple moving averages with different lengths to understand short-term and long-term price direction. Alongside this, it calculates volatility using ATR (Average True Range), which helps the system understand how “fast” or “slow” the market is moving. This combination forms the base layer of decision-making.
2. Trend Construction Engine
The core trend is not based on a simple crossover alone. Instead, the system compares a faster moving average with a slower one and then adjusts them using volatility. If the faster structure stays above the slower structure, the system considers the market bullish, and vice versa for bearish conditions. ATR adjustment ensures that trend detection adapts to changing volatility, meaning the trend signal becomes more stable in noisy markets and more responsive in active markets.
3. Structure-Based Retest Logic
Once trend direction is identified, the system waits for price to “retest” a key dynamic level instead of reacting instantly. This is calculated using crossover and crossunder conditions around the adjusted moving average levels. The idea is that strong moves often pause and revisit key areas before continuing. The indicator only activates signals when this retest aligns with the current trend direction and confirmation conditions are satisfied.
4. Volatility Intelligence Layer
HEENA 12 continuously measures volatility using both short-term and long-term ATR values. These are compared to create a volatility ratio, which determines how active or quiet the market is. This ratio directly affects signal behavior through the adaptive cooldown system. In high volatility, signals can appear faster; in low volatility, the system slows down to avoid noise and false setups.
5. Signal Filtering Engine (Quality Control System)
Before any signal is displayed, multiple filters must be passed:
Trend Confirmation Filter → Ensures signal aligns with current trend
Band Filter → Ensures price is in a valid structural zone
Volatility Filter → Blocks signals in weak or sideways conditions
Smart Filter → Limits repeated signals within the same trend phase
This multi-layer filtering ensures that only structured, high-quality conditions are shown instead of random or frequent signals.
6. Adaptive Cooldown Mechanism (Signal Spacing Control)
After each valid signal, the system activates a cooldown period. This cooldown is not fixed; it changes dynamically based on volatility. If the market is fast, the cooldown reduces slightly to allow more responsive signals. If the market is slow, it increases to prevent unnecessary entries. This ensures balanced signal flow across all market conditions.
7. Band Structure & Price Position Logic
The indicator builds a multi-level band system using statistical calculations similar to Bollinger Bands. These bands are then smoothed using a Gaussian-based approach (Nadaraya-style smoothing). This creates a more stable representation of price zones. The system uses these bands to determine whether price is in a normal zone, overextended zone, or reverting zone.
8. Mean Reversion Detection System
Apart from trend continuation, the system also monitors when price moves too far from its equilibrium zone. When price crosses back toward the central band, it can trigger mean reversion signals. These signals are separate from trend signals and represent short-term correction behavior rather than full trend direction.
9. Smart Trend Memory (Signal Control Logic)
The system tracks whether a signal has already occurred within a trend phase. Once a signal is generated, it prevents repeated signals until a meaningful trend change happens. This “memory system” ensures that the indicator does not spam entries and maintains signal clarity throughout the trend lifecycle.
10. Visualization & Decision Layer
Finally, all processed data is converted into visual outputs—BUY/SELL signals, mean reversion markers, band fills, and trend dashboard. These visuals are not raw calculations; they are the final filtered output of multiple internal layers working together. The dashboard further summarizes trend direction across timeframe context for quick interpretation.
Final Working Concept (Simple Summary of Complex System)
HEENA 12 works like a multi-stage decision engine:
Reads market structure (trend + volatility)
Waits for structured retracement (retest logic)
Checks multiple filters (quality control system)
Controls signal frequency (adaptive cooldown)
Confirms price position using bands
Outputs only high-confidence signals
Final Perspective
In simple terms, HEENA 12 does not react to every movement. It observes, filters, confirms, and then signals. Its strength lies not in prediction, but in structured interpretation of market behavior using multiple internal validation layers.
Settings and Customization (Deep Control System)
This indicator offers a high level of customization. Users can adjust timeframes, moving average types, and sensitivity settings to match their trading style. Shorter settings create faster signals, while higher values produce more stable but fewer signals.
Band settings allow control over how tight or wide the market structure appears. Increasing deviation values creates wider zones, while lowering them makes signals more sensitive.
Signal filters such as volatility filter, smart filter, and confluence threshold allow traders to control signal frequency and quality. For example, enabling confluence filter ensures that signals only appear when multiple timeframes agree, making the system more conservative but higher quality.
Overall, customization is designed so traders can switch between aggressive scalping mode and conservative trend-following mode depending on market conditions.
Combined Mashup System (Deep Structure Overview )
The HEENA 12 [CLEVER] script is essentially a multi-system fusion indicator, where different trading methodologies are merged into one unified decision engine. Instead of relying on a single strategy type, it combines trend following, mean reversion, volatility modeling, and multi-timeframe confirmation into one framework. This “mashup system” is designed to reduce weak signals and improve decision quality by requiring multiple conditions to align before giving a trade signal.
At a high level, the system works like a layered filter model: raw market data enters the system, then passes through several analytical layers (trend layer → volatility layer → band structure layer → confirmation layer → signal layer). Only when enough layers agree does the final BUY or SELL signal appear.
1. Trend Engine + Multi-Timeframe Fusion
The first major component of the mashup system is the trend engine, built using fast and slow moving averages. Instead of using one timeframe, it checks multiple timeframes simultaneously.
Each timeframe independently calculates whether the market is bullish or bearish based on MA relationships and ATR-adjusted structure. Then the system compares all timeframes together to determine:
Is the market aligned bullish across most timeframes?
Is the market aligned bearish across most timeframes?
Or is there disagreement (chop zone)?
This creates a trend confluence layer, meaning signals are only valid when the market structure is not fragmented.
2. Volatility Intelligence Layer (ATR-Based Logic)
The second layer is volatility intelligence. The system uses ATR (Average True Range) to understand market energy.
This layer controls:
When signals should be allowed (high volatility = active trading zone)
When signals should be filtered out (low volatility = chop/noise)
Adaptive cooldown timing (more volatility = more spacing between signals)
This makes the system behave like a dynamic filter that adapts to market speed, instead of producing fixed behavior.
3. Statistical Band System (Clever Bands Core)
The next layer is the Clever Bands system, which is based on Bollinger-style deviation bands but enhanced with smoothing and multi-level structure.
Instead of just one band, it builds:
Short-term band (fast reaction zone)
Medium-term band (trend confirmation zone)
Long-term band (structural market boundary)
These bands are then smoothed using a kernel-based approach (Nadaraya-Watson concept), which removes noise and creates more stable dynamic zones.
So the market is no longer seen as just price action — it is seen as a probability zone structure.
4. Signal Logic Layer (Event Detection System)
This is where actual trade signals are created.
The system detects:
Trend retests (price interacting with moving average after confirmation)
Breaks and crossovers (structure shifts)
Mean reversion events (price returning from extreme band levels)
But importantly, signals are NOT triggered directly. They must pass multiple filters:
Trend alignment check
Band position validation
Volatility confirmation
Cooldown restriction
Multi-timeframe agreement (optional)
This makes the system behave like an event-based trigger engine, not a continuous indicator.
5. Smart Filtering System (Noise Reduction Layer)
A key part of the mashup system is intelligent filtering. It prevents overtrading by adding constraints like:
Smart filter (one signal per trend phase)
Volatility filter (avoid sideways chop)
Band filter (only trade in meaningful zones)
Adaptive cooldown (prevents rapid-fire signals)
This ensures the system prioritizes quality over quantity, which is critical in real trading environments.
6. Final Decision Engine (Signal Output Layer)
After all previous layers agree, the final system produces:
BUY signals (trend continuation or mean reversion confirmation)
SELL signals (trend continuation or reversal confirmation)
Strong signals (multi-timeframe confluence confirmation)
Mean reversion signals (counter-trend opportunities)
At this stage, the system is no longer reacting to raw price—it is reacting to a filtered consensus of multiple market models.
Final Interpretation
This mashup system is not a simple indicator. It behaves more like a multi-model trading framework, where:
Trend logic defines direction
Volatility defines safety zone
Bands define structure boundaries
Filters remove noise
Signals represent final consensus decisions
In practical terms, it tries to answer one question:
“Is this market condition strong enough, aligned enough, and stable enough to justify a trade?”
If the answer is yes across multiple layers, the signal is generated.
Final Note
The HEENA 12 [CLEVER] system is a multi-layer trading framework that combines trend analysis, volatility measurement, statistical band structure, and multi-timeframe confirmation into one unified decision model. Instead of relying on a single indicator signal, it builds a structured process where market conditions are evaluated step by step before any BUY or SELL signal is produced.
The core strength of this system is that it filters market noise through multiple independent layers. First, it determines the overall market trend using moving averages across different timeframes. Then it evaluates volatility conditions using ATR to understand whether the market is active or sideways. After that, it maps price into dynamic band zones that represent statistical boundaries of movement. Only when these conditions align together does the system allow a trade signal.
This layered approach ensures that signals are not random or overly frequent. Instead, they represent a confluence of trend direction, market structure, and volatility context, which helps improve quality and reduce false entries. The inclusion of filters like cooldown logic, smart trend control, and optional confluence checking further refines signal accuracy.
Overall, this system is designed for traders who prefer structured decision-making rather than emotional or impulsive trading. It works best when used as a confirmation tool in trending or clearly structured market conditions, where multiple layers of agreement can validate stronger trade setups.
Disclaimer
This indicator, including all signals, calculations, filters, and visual outputs, is provided strictly for educational and analytical purposes only. It is designed to help users study market structure, trend behavior, volatility dynamics, and multi-timeframe confluence concepts. It does not guarantee any specific outcome, profitability, or accuracy in live trading conditions.
All trading signals generated by this system are based on mathematical models, historical price behavior, and statistical approximations. While the system attempts to reduce noise through filtering and multi-layer confirmation, market conditions can change rapidly and unpredictably. As a result, signals may occasionally be delayed, invalidated, or affected by sudden volatility spikes.
The indicator includes optional smoothing and advanced calculations that may behave differently depending on settings. Some features, such as smoothing-based estimation, can visually adjust past data representation. However, all primary signals are designed to be based on confirmed candle conditions unless explicitly stated otherwise in settings.
Users should understand that financial markets involve high risk, and no indicator can fully eliminate losses or guarantee consistent performance. This tool should not be considered financial advice, investment advice, or a recommendation to buy or sell any asset.
Traders are fully responsible for their own decisions, risk management, and capital allocation. It is strongly recommended to test this system in a demo environment before using it in live markets and to combine it with proper risk controls such as stop-loss and position sizing.
By using this script, you acknowledge that all trading decisions are made at your own discretion and risk.
1. System Philosophy & Design Approach
HEENA 12 is an advanced, rule-based trading indicator designed to analyze market behavior through a structured and multi-layered framework. Instead of relying on a single signal type, it integrates trend-following and mean reversion concepts to provide a more balanced analytical perspective. The system focuses on identifying meaningful market conditions rather than generating constant signals, ensuring that outputs are condition-based and filtered. This approach helps users interpret price action within a broader context, improving clarity and decision support without making exaggerated performance claims.
2. Trend Detection Engine
At its core, the indicator uses a moving average–based trend model enhanced with volatility adjustments through ATR (Average True Range). This creates a more adaptive trend detection mechanism compared to traditional crossover systems. By accounting for market volatility, the trend signals become more stable and less prone to noise or false breakouts. The system is designed to adapt across different market speeds, making it suitable for both slower and more dynamic environments.
3. Entry Logic & Retest Structure
Rather than triggering entries on immediate breakouts, HEENA 12 applies a retest-based logic. This means signals are generated when price pulls back toward a key level and then resumes movement in the direction of the trend. Such an approach emphasizes timing and structure, aiming to reduce impulsive entries and improve the quality of signal conditions. This design aligns with common market behavior where trends often include retracements before continuation.
4. Advanced Filtering Mechanisms
A key strength of the system lies in its filtering capabilities. It incorporates a volatility filter to reduce signals during low-activity or sideways market conditions. Additionally, an adaptive cooldown mechanism dynamically adjusts signal frequency based on current volatility levels, making the system more responsive in active markets and more selective in slower conditions. A smart filtering layer further limits signal repetition within the same trend phase, helping maintain a cleaner and more focused chart environment.
5. Bands & Price Structure Analysis
The indicator includes an enhanced band system inspired by Bollinger Bands, combined with smoothing techniques to improve visual clarity. These bands are not purely decorative; they act as structural zones that help validate signal conditions. Signals are more likely to appear when price interacts with these zones in a meaningful way. Alongside this, mean reversion signals are included to highlight situations where price returns from extreme levels back toward equilibrium, offering additional analytical insight.
6. Performance Optimization & Transparency
HEENA 12 incorporates optimization features such as a lite mode to reduce computational load and improve performance on different systems. It is designed to operate as a non-repainting tool on confirmed candles, ensuring signal stability after candle closure. An optional smoothing feature is available, with clear disclosure that it may adjust historical values for visualization purposes. This transparency aligns with platform guidelines and supports realistic user expectations.
7. Overall Purpose & Use Case
Overall, HEENA 12 functions as a comprehensive analytical tool intended to support structured decision-making. Its primary goal is not to guarantee outcomes but to enhance market interpretation through improved timing, filtered signals, and contextual awareness. By combining multiple analytical layers into a single system, it provides users with a clearer and more disciplined framework for evaluating price action.
Core Concept
1. Multi-Layered Market Interpretation
The core concept of HEENA 12 is built around understanding the market as a combination of trend, volatility, and price behavior rather than relying on a single indicator signal. It does not treat price movement as random; instead, it assumes that markets move in structured phases—trending, retracing, and consolidating. By combining multiple analytical layers, the system aims to provide a clearer interpretation of these phases. This layered approach helps reduce dependency on isolated signals and encourages a more context-driven view of market conditions.
2. Adaptive Trend Framework
At the heart of the system lies an adaptive trend model that blends moving averages with volatility measurements. Instead of using static trend definitions, the indicator adjusts its behavior based on how active or quiet the market is. This allows it to better align with real-time conditions, where price movement is rarely uniform. The goal of this framework is to identify directional bias while minimizing sensitivity to short-term noise, thereby supporting a more stable analytical foundation.
3. Structured Entry Philosophy
A key principle behind HEENA 12 is that meaningful opportunities often occur during retracements within a broader trend rather than at initial breakouts. The system reflects this by focusing on retest-based conditions, where price temporarily moves against the prevailing direction before continuing. This concept is rooted in the idea that markets tend to revisit important levels before making sustained moves. By emphasizing structure over immediacy, the indicator promotes a more measured approach to interpreting potential setups.
4. Signal Quality Over Quantity
Another fundamental concept is prioritizing signal quality instead of frequency. The system incorporates multiple filters designed to limit signals during unclear or low-activity conditions. These filters consider volatility levels, trend consistency, and recent signal history to avoid repetitive or low-confidence outputs. This reflects the broader philosophy that fewer, more refined signals can provide better analytical value than constant, unfiltered activity.
5. Price Extremes & Mean Reversion Awareness
In addition to trend continuation, the indicator acknowledges that markets can temporarily move away from equilibrium and then revert back. This is addressed through its band-based structure, which highlights relative price extremes. When price extends beyond typical ranges and begins to return, it can indicate a shift in short-term behavior. By incorporating both continuation and reversion perspectives, the system offers a more comprehensive understanding of how price interacts with its surrounding environment.
6. Context-Driven Decision Support
HEENA 12 is designed to assist in decision-making rather than automate it. Its outputs are intended to be interpreted within the broader market context, including timeframe selection, volatility conditions, and overall structure. The system does not assume that any single signal guarantees an outcome; instead, it provides structured information to support more informed analysis. This aligns with responsible usage practices and emphasizes the importance of user discretion.
7. Transparency & Responsible Design
A defining aspect of the core concept is transparency in how the indicator behaves. It clearly distinguishes between stable signals (based on confirmed data) and optional visual enhancements that may adjust historical values. This ensures that users understand the difference between analytical output and visual smoothing. By maintaining clarity and avoiding exaggerated claims, the system adheres to platform guidelines and promotes realistic expectations.
Final Perspective
At its core, HEENA 12 is not just a signal generator but a structured analytical framework. It combines trend identification, volatility adaptation, and price structure awareness into a unified system aimed at improving how market behavior is interpreted. Its primary value lies in organizing complex market information into a more understandable form, supporting disciplined and context-aware analysis.
Key Features
1. Adaptive Trend Detection Engine
HEENA 12 uses a dynamic trend detection model based on moving averages combined with volatility measurements. Instead of relying on fixed conditions, the system adjusts its interpretation of trend strength according to market activity. This allows it to remain stable during normal fluctuations while still responding to meaningful directional changes. The objective is to provide a clearer sense of market bias without overreacting to short-term noise.
2. Retest-Based Signal Logic
A central feature of the system is its focus on retest conditions rather than immediate breakouts. Signals are generated when price revisits a key level and shows signs of continuing in the prevailing direction. This approach reflects common market behavior where price often retraces before moving further. By emphasizing structure, the system aims to highlight more contextually relevant situations rather than frequent but less refined signals.
3. Volatility-Aware Filtering System
The indicator incorporates a volatility filter to manage signal quality across different market conditions. During periods of low activity or consolidation, signals are reduced to avoid noise. In more active environments, the system becomes more responsive. This helps maintain consistency in how signals are interpreted, ensuring that outputs are better aligned with the current market environment.
4. Adaptive Cooldown Mechanism
To prevent excessive signal generation, HEENA 12 includes a cooldown feature that dynamically adjusts based on volatility levels. When the market is moving quickly, the system allows signals to appear more frequently. In slower conditions, it increases the spacing between signals. This adaptive behavior supports a more balanced flow of information and reduces unnecessary repetition.
5. Smart Signal Limitation (Trend-Based Filtering)
The system introduces a smart filtering layer that limits signal repetition within the same trend phase. Once a valid signal has been identified, additional signals in the same direction are restricted unless conditions meaningfully change. This helps keep the chart clean and encourages focus on higher-quality setups rather than continuous entries in the same trend.
6. Enhanced Band Structure with Smoothing
HEENA 12 features a band-based structure inspired by traditional volatility bands, enhanced with smoothing techniques for improved clarity. These bands act as reference zones that help contextualize price movement. Rather than serving only as a visual guide, they play a role in validating signal conditions, ensuring that price is interacting with meaningful areas before a signal is considered.
7. Mean Reversion Awareness
In addition to trend continuation, the system includes a mechanism to highlight situations where price moves away from its typical range and begins to return. This provides insight into short-term shifts in behavior and complements the trend-based approach. By including both continuation and reversion perspectives, the indicator supports a more complete view of market dynamics.
8. Configurable Inputs & User Control
The indicator offers a range of customizable settings, allowing users to adjust parameters such as smoothing intensity, signal filtering behavior, and visual preferences. This flexibility makes it adaptable to different trading styles and timeframes, while still maintaining its core analytical structure.
9. Performance Optimization (Lite Mode)
To ensure smooth operation across different environments, HEENA 12 includes an optional lite mode that reduces computational load. This is particularly useful when working with complex calculations or extended historical data, allowing users to maintain performance without significantly altering the analytical output.
10. Non-Repainting Signal Behavior (with Transparency)
Signals are designed to remain stable once a candle is confirmed, supporting consistent analysis. At the same time, the system provides an optional smoothing feature with clear disclosure that it may adjust historical values for visualization purposes. This transparency helps users distinguish between analytical signals and visual enhancements, aligning with responsible usage practices.
Final Perspective
The key features of HEENA 12 are built around one principle: delivering structured, context-aware insights rather than constant signal output. By combining adaptive trend logic, volatility-aware filtering, and price structure analysis, the system provides a refined analytical tool that supports disciplined and informed market evaluation.
How to Use (Deep & Structured Guide)
1. Understanding the Indicator’s Role
HEENA 12 is designed as a decision-support tool, not an automated trading system. Its purpose is to help interpret market structure by combining trend direction, volatility conditions, and price positioning. Before using it, it is important to approach the signals as analytical guidance rather than fixed instructions. The indicator works best when used alongside basic chart reading, such as identifying key levels and overall market context.
2. Identifying Market Direction (First Step)
Start by observing the trend direction shown by the indicator. The color shifts and overall signal bias help indicate whether the market is leaning bullish or bearish. Instead of reacting immediately, use this information to form a directional bias. For example, if the system reflects an upward trend, focus more on buy-side conditions and avoid forcing trades against that direction unless there is a strong contextual reason.
3. Using Retest Signals for Contextual Entries
The primary signals are based on retest behavior, meaning price revisits a level before continuing in the trend direction. When a signal appears, it represents a moment where price structure aligns with the identified trend. Rather than acting instantly, it is more effective to observe how price behaves around that signal area—such as whether it holds above or below nearby levels. This adds confirmation and improves interpretation.
4. Applying the Band Structure for Validation
The band system provides a visual framework for understanding where price is positioned relative to its typical range. When price is within the bands, it often reflects normal conditions, while movement toward the outer areas may indicate stronger momentum or temporary extremes. Use this structure to validate whether a signal is occurring in a logical zone rather than in an overextended or unclear area.
5. Interpreting Mean Reversion Signals
Mean reversion signals highlight situations where price moves away from its usual range and then begins to return. These signals can indicate short-term changes in behavior but should be interpreted carefully. They are most useful when considered alongside the broader trend, as they may represent temporary pullbacks rather than full reversals. Combining this insight with overall market direction helps avoid misinterpretation.
6. Leveraging Filters for Better Clarity
HEENA 12 includes built-in filters that automatically reduce signals during low-volatility or sideways conditions. When signals are less frequent, it often indicates that the market lacks clear direction. Instead of forcing trades during these periods, it is generally more effective to wait for conditions where the indicator becomes more active again. This helps maintain a disciplined and patient approach.
7. Managing Signal Frequency with Cooldown Logic
The adaptive cooldown feature controls how often signals appear based on market activity. In fast-moving conditions, signals may appear closer together, while in slower environments, they are spaced further apart. This behavior helps maintain balance and prevents over-reliance on repetitive signals. Users should respect this spacing rather than trying to anticipate or override it.
8. Adjusting Settings Based on Preference
The indicator provides several customizable options, such as smoothing levels, filter sensitivity, and performance modes. Users can adjust these settings to better match their preferred timeframe or chart style. However, it is recommended to make gradual changes and observe how they affect the indicator’s behavior, rather than making multiple adjustments at once.
9. Using the Dashboard for Quick Reference
The built-in dashboard offers a quick view of the current trend status for the selected timeframe. This can be used as a reference point when analyzing the chart, helping to confirm whether current signals align with the broader direction. It serves as a summary tool rather than a standalone decision-maker.
10. Maintaining a Responsible Approach
HEENA 12 is most effective when used with a structured and disciplined mindset. Signals should be interpreted within the context of overall market conditions, and no single output should be treated as a guaranteed outcome. The indicator is designed to enhance clarity and support analysis, not to replace judgment. Maintaining realistic expectations and combining it with sound risk management practices is essential.
Final Perspective
Using HEENA 12 effectively involves more than reacting to signals—it requires understanding how its components interact. By combining trend awareness, structured entry conditions, and volatility-based filtering, the indicator provides a refined framework for analyzing price behavior. When used thoughtfully, it can improve consistency and clarity in market evaluation while remaining aligned with responsible trading practices.
How It Works (Deep Internal Logic Overview)
1. Market Data Processing Layer (Foundation)
HEENA 12 starts by taking raw price data (open, high, low, close) and converting it into structured analytical values. It applies multiple moving averages with different lengths to understand short-term and long-term price direction. Alongside this, it calculates volatility using ATR (Average True Range), which helps the system understand how “fast” or “slow” the market is moving. This combination forms the base layer of decision-making.
2. Trend Construction Engine
The core trend is not based on a simple crossover alone. Instead, the system compares a faster moving average with a slower one and then adjusts them using volatility. If the faster structure stays above the slower structure, the system considers the market bullish, and vice versa for bearish conditions. ATR adjustment ensures that trend detection adapts to changing volatility, meaning the trend signal becomes more stable in noisy markets and more responsive in active markets.
3. Structure-Based Retest Logic
Once trend direction is identified, the system waits for price to “retest” a key dynamic level instead of reacting instantly. This is calculated using crossover and crossunder conditions around the adjusted moving average levels. The idea is that strong moves often pause and revisit key areas before continuing. The indicator only activates signals when this retest aligns with the current trend direction and confirmation conditions are satisfied.
4. Volatility Intelligence Layer
HEENA 12 continuously measures volatility using both short-term and long-term ATR values. These are compared to create a volatility ratio, which determines how active or quiet the market is. This ratio directly affects signal behavior through the adaptive cooldown system. In high volatility, signals can appear faster; in low volatility, the system slows down to avoid noise and false setups.
5. Signal Filtering Engine (Quality Control System)
Before any signal is displayed, multiple filters must be passed:
Trend Confirmation Filter → Ensures signal aligns with current trend
Band Filter → Ensures price is in a valid structural zone
Volatility Filter → Blocks signals in weak or sideways conditions
Smart Filter → Limits repeated signals within the same trend phase
This multi-layer filtering ensures that only structured, high-quality conditions are shown instead of random or frequent signals.
6. Adaptive Cooldown Mechanism (Signal Spacing Control)
After each valid signal, the system activates a cooldown period. This cooldown is not fixed; it changes dynamically based on volatility. If the market is fast, the cooldown reduces slightly to allow more responsive signals. If the market is slow, it increases to prevent unnecessary entries. This ensures balanced signal flow across all market conditions.
7. Band Structure & Price Position Logic
The indicator builds a multi-level band system using statistical calculations similar to Bollinger Bands. These bands are then smoothed using a Gaussian-based approach (Nadaraya-style smoothing). This creates a more stable representation of price zones. The system uses these bands to determine whether price is in a normal zone, overextended zone, or reverting zone.
8. Mean Reversion Detection System
Apart from trend continuation, the system also monitors when price moves too far from its equilibrium zone. When price crosses back toward the central band, it can trigger mean reversion signals. These signals are separate from trend signals and represent short-term correction behavior rather than full trend direction.
9. Smart Trend Memory (Signal Control Logic)
The system tracks whether a signal has already occurred within a trend phase. Once a signal is generated, it prevents repeated signals until a meaningful trend change happens. This “memory system” ensures that the indicator does not spam entries and maintains signal clarity throughout the trend lifecycle.
10. Visualization & Decision Layer
Finally, all processed data is converted into visual outputs—BUY/SELL signals, mean reversion markers, band fills, and trend dashboard. These visuals are not raw calculations; they are the final filtered output of multiple internal layers working together. The dashboard further summarizes trend direction across timeframe context for quick interpretation.
Final Working Concept (Simple Summary of Complex System)
HEENA 12 works like a multi-stage decision engine:
Reads market structure (trend + volatility)
Waits for structured retracement (retest logic)
Checks multiple filters (quality control system)
Controls signal frequency (adaptive cooldown)
Confirms price position using bands
Outputs only high-confidence signals
Final Perspective
In simple terms, HEENA 12 does not react to every movement. It observes, filters, confirms, and then signals. Its strength lies not in prediction, but in structured interpretation of market behavior using multiple internal validation layers.
Settings and Customization (Deep Control System)
This indicator offers a high level of customization. Users can adjust timeframes, moving average types, and sensitivity settings to match their trading style. Shorter settings create faster signals, while higher values produce more stable but fewer signals.
Band settings allow control over how tight or wide the market structure appears. Increasing deviation values creates wider zones, while lowering them makes signals more sensitive.
Signal filters such as volatility filter, smart filter, and confluence threshold allow traders to control signal frequency and quality. For example, enabling confluence filter ensures that signals only appear when multiple timeframes agree, making the system more conservative but higher quality.
Overall, customization is designed so traders can switch between aggressive scalping mode and conservative trend-following mode depending on market conditions.
Combined Mashup System (Deep Structure Overview )
The HEENA 12 [CLEVER] script is essentially a multi-system fusion indicator, where different trading methodologies are merged into one unified decision engine. Instead of relying on a single strategy type, it combines trend following, mean reversion, volatility modeling, and multi-timeframe confirmation into one framework. This “mashup system” is designed to reduce weak signals and improve decision quality by requiring multiple conditions to align before giving a trade signal.
At a high level, the system works like a layered filter model: raw market data enters the system, then passes through several analytical layers (trend layer → volatility layer → band structure layer → confirmation layer → signal layer). Only when enough layers agree does the final BUY or SELL signal appear.
1. Trend Engine + Multi-Timeframe Fusion
The first major component of the mashup system is the trend engine, built using fast and slow moving averages. Instead of using one timeframe, it checks multiple timeframes simultaneously.
Each timeframe independently calculates whether the market is bullish or bearish based on MA relationships and ATR-adjusted structure. Then the system compares all timeframes together to determine:
Is the market aligned bullish across most timeframes?
Is the market aligned bearish across most timeframes?
Or is there disagreement (chop zone)?
This creates a trend confluence layer, meaning signals are only valid when the market structure is not fragmented.
2. Volatility Intelligence Layer (ATR-Based Logic)
The second layer is volatility intelligence. The system uses ATR (Average True Range) to understand market energy.
This layer controls:
When signals should be allowed (high volatility = active trading zone)
When signals should be filtered out (low volatility = chop/noise)
Adaptive cooldown timing (more volatility = more spacing between signals)
This makes the system behave like a dynamic filter that adapts to market speed, instead of producing fixed behavior.
3. Statistical Band System (Clever Bands Core)
The next layer is the Clever Bands system, which is based on Bollinger-style deviation bands but enhanced with smoothing and multi-level structure.
Instead of just one band, it builds:
Short-term band (fast reaction zone)
Medium-term band (trend confirmation zone)
Long-term band (structural market boundary)
These bands are then smoothed using a kernel-based approach (Nadaraya-Watson concept), which removes noise and creates more stable dynamic zones.
So the market is no longer seen as just price action — it is seen as a probability zone structure.
4. Signal Logic Layer (Event Detection System)
This is where actual trade signals are created.
The system detects:
Trend retests (price interacting with moving average after confirmation)
Breaks and crossovers (structure shifts)
Mean reversion events (price returning from extreme band levels)
But importantly, signals are NOT triggered directly. They must pass multiple filters:
Trend alignment check
Band position validation
Volatility confirmation
Cooldown restriction
Multi-timeframe agreement (optional)
This makes the system behave like an event-based trigger engine, not a continuous indicator.
5. Smart Filtering System (Noise Reduction Layer)
A key part of the mashup system is intelligent filtering. It prevents overtrading by adding constraints like:
Smart filter (one signal per trend phase)
Volatility filter (avoid sideways chop)
Band filter (only trade in meaningful zones)
Adaptive cooldown (prevents rapid-fire signals)
This ensures the system prioritizes quality over quantity, which is critical in real trading environments.
6. Final Decision Engine (Signal Output Layer)
After all previous layers agree, the final system produces:
BUY signals (trend continuation or mean reversion confirmation)
SELL signals (trend continuation or reversal confirmation)
Strong signals (multi-timeframe confluence confirmation)
Mean reversion signals (counter-trend opportunities)
At this stage, the system is no longer reacting to raw price—it is reacting to a filtered consensus of multiple market models.
Final Interpretation
This mashup system is not a simple indicator. It behaves more like a multi-model trading framework, where:
Trend logic defines direction
Volatility defines safety zone
Bands define structure boundaries
Filters remove noise
Signals represent final consensus decisions
In practical terms, it tries to answer one question:
“Is this market condition strong enough, aligned enough, and stable enough to justify a trade?”
If the answer is yes across multiple layers, the signal is generated.
Final Note
The HEENA 12 [CLEVER] system is a multi-layer trading framework that combines trend analysis, volatility measurement, statistical band structure, and multi-timeframe confirmation into one unified decision model. Instead of relying on a single indicator signal, it builds a structured process where market conditions are evaluated step by step before any BUY or SELL signal is produced.
The core strength of this system is that it filters market noise through multiple independent layers. First, it determines the overall market trend using moving averages across different timeframes. Then it evaluates volatility conditions using ATR to understand whether the market is active or sideways. After that, it maps price into dynamic band zones that represent statistical boundaries of movement. Only when these conditions align together does the system allow a trade signal.
This layered approach ensures that signals are not random or overly frequent. Instead, they represent a confluence of trend direction, market structure, and volatility context, which helps improve quality and reduce false entries. The inclusion of filters like cooldown logic, smart trend control, and optional confluence checking further refines signal accuracy.
Overall, this system is designed for traders who prefer structured decision-making rather than emotional or impulsive trading. It works best when used as a confirmation tool in trending or clearly structured market conditions, where multiple layers of agreement can validate stronger trade setups.
Disclaimer
This indicator, including all signals, calculations, filters, and visual outputs, is provided strictly for educational and analytical purposes only. It is designed to help users study market structure, trend behavior, volatility dynamics, and multi-timeframe confluence concepts. It does not guarantee any specific outcome, profitability, or accuracy in live trading conditions.
All trading signals generated by this system are based on mathematical models, historical price behavior, and statistical approximations. While the system attempts to reduce noise through filtering and multi-layer confirmation, market conditions can change rapidly and unpredictably. As a result, signals may occasionally be delayed, invalidated, or affected by sudden volatility spikes.
The indicator includes optional smoothing and advanced calculations that may behave differently depending on settings. Some features, such as smoothing-based estimation, can visually adjust past data representation. However, all primary signals are designed to be based on confirmed candle conditions unless explicitly stated otherwise in settings.
Users should understand that financial markets involve high risk, and no indicator can fully eliminate losses or guarantee consistent performance. This tool should not be considered financial advice, investment advice, or a recommendation to buy or sell any asset.
Traders are fully responsible for their own decisions, risk management, and capital allocation. It is strongly recommended to test this system in a demo environment before using it in live markets and to combine it with proper risk controls such as stop-loss and position sizing.
By using this script, you acknowledge that all trading decisions are made at your own discretion and risk.
Open-source Skript
Ganz im Sinne von TradingView hat dieser Autor sein/ihr Script als Open-Source veröffentlicht. Auf diese Weise können nun auch andere Trader das Script rezensieren und die Funktionalität überprüfen. Vielen Dank an den Autor! Sie können das Script kostenlos verwenden, aber eine Wiederveröffentlichung des Codes unterliegt unseren Hausregeln.

Haftungsausschluss
Die Informationen und Veröffentlichungen sind nicht als Finanz-, Anlage-, Handels- oder andere Arten von Ratschlägen oder Empfehlungen gedacht, die von TradingView bereitgestellt oder gebilligt werden, und stellen diese nicht dar. Lesen Sie mehr in den Nutzungsbedingungen.
Open-source Skript
Ganz im Sinne von TradingView hat dieser Autor sein/ihr Script als Open-Source veröffentlicht. Auf diese Weise können nun auch andere Trader das Script rezensieren und die Funktionalität überprüfen. Vielen Dank an den Autor! Sie können das Script kostenlos verwenden, aber eine Wiederveröffentlichung des Codes unterliegt unseren Hausregeln.
Haftungsausschluss
Die Informationen und Veröffentlichungen sind nicht als Finanz-, Anlage-, Handels- oder andere Arten von Ratschlägen oder Empfehlungen gedacht, die von TradingView bereitgestellt oder gebilligt werden, und stellen diese nicht dar. Lesen Sie mehr in den Nutzungsbedingungen.