OPEN-SOURCE SCRIPT
Descriptive Statistics [Variance]
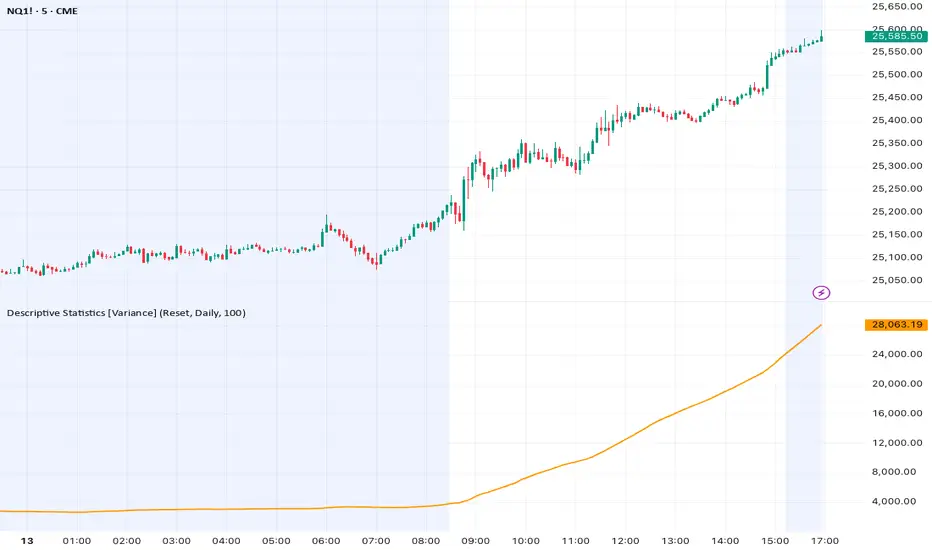
This indicator displays the Mean and Variance of price over a selected dataset. It is designed to describe the central value of price and the degree of dispersion around it.
The Mean represents the average price level over the selected period. It acts as the central reference point of the dataset.
Variance measures how spread out price values are around the Mean. It reflects the degree of variability or instability in price movement over time.
What it shows?
1. Mean: The average price level of the selected data.
2. Variance: The average squared deviation of price from the Mean.
Key concept
1. The Mean describes the center of price behavior.
2. The Variance describes how widely price moves around that center.
Together, they provide a basic statistical view of market structure and volatility.
⚠️ Note
This indicator is for analytical and educational purposes only and does not provide trading signals or directional predictions.
AUTHOR: TUGUME WILLIAM MUTARA
The Mean represents the average price level over the selected period. It acts as the central reference point of the dataset.
Variance measures how spread out price values are around the Mean. It reflects the degree of variability or instability in price movement over time.
What it shows?
1. Mean: The average price level of the selected data.
2. Variance: The average squared deviation of price from the Mean.
Key concept
1. The Mean describes the center of price behavior.
2. The Variance describes how widely price moves around that center.
Together, they provide a basic statistical view of market structure and volatility.
⚠️ Note
This indicator is for analytical and educational purposes only and does not provide trading signals or directional predictions.
AUTHOR: TUGUME WILLIAM MUTARA
Open-source Skript
Ganz im Sinne von TradingView hat dieser Autor sein/ihr Script als Open-Source veröffentlicht. Auf diese Weise können nun auch andere Trader das Script rezensieren und die Funktionalität überprüfen. Vielen Dank an den Autor! Sie können das Script kostenlos verwenden, aber eine Wiederveröffentlichung des Codes unterliegt unseren Hausregeln.

Haftungsausschluss
Die Informationen und Veröffentlichungen sind nicht als Finanz-, Anlage-, Handels- oder andere Arten von Ratschlägen oder Empfehlungen gedacht, die von TradingView bereitgestellt oder gebilligt werden, und stellen diese nicht dar. Lesen Sie mehr in den Nutzungsbedingungen.
Open-source Skript
Ganz im Sinne von TradingView hat dieser Autor sein/ihr Script als Open-Source veröffentlicht. Auf diese Weise können nun auch andere Trader das Script rezensieren und die Funktionalität überprüfen. Vielen Dank an den Autor! Sie können das Script kostenlos verwenden, aber eine Wiederveröffentlichung des Codes unterliegt unseren Hausregeln.
Haftungsausschluss
Die Informationen und Veröffentlichungen sind nicht als Finanz-, Anlage-, Handels- oder andere Arten von Ratschlägen oder Empfehlungen gedacht, die von TradingView bereitgestellt oder gebilligt werden, und stellen diese nicht dar. Lesen Sie mehr in den Nutzungsbedingungen.