OPEN-SOURCE SCRIPT
Swing High/Low Lines (Break Stop)
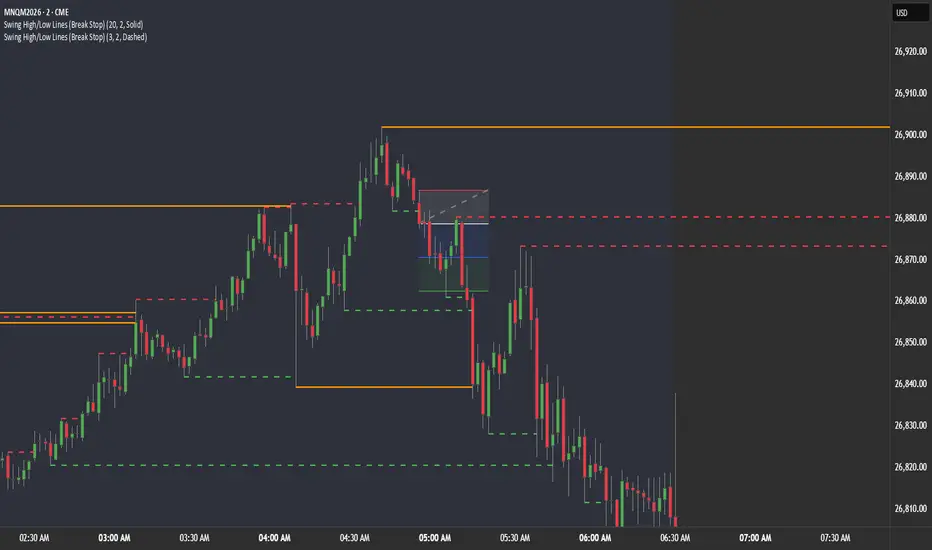
Swing High/Low Lines (with alerts) – Strategy Description
This indicator automatically identifies market structure using swing highs and swing lows, then plots horizontal levels that extend forward until price breaks them. It is designed to track liquidity levels, highlight potential breakout points, and provide clean, event-based alerts.
Core Functionality
Detects swing highs and swing lows using a configurable strength setting
Plots each swing as a horizontal line starting at the pivot point
Lines extend forward in real time until price interacts with them
Once a level is broken, the line stops extending and is removed from tracking
Swing Detection
Uses ta.pivothigh and ta.pivotlow
The strength input defines how many candles are required on each side of a pivot
Higher strength = fewer, more significant levels
Lower strength = more frequent, sensitive levels
Line Behavior
Each swing level is drawn as an independent horizontal line
Lines extend right automatically as long as they remain unbroken
When price breaks a level:
The line is cut off at the break point
It is removed from active tracking
Prevents clutter by only keeping valid, untested levels active
Break Logic
Configurable via “Break on Wick” option:
Enabled (default):
A level is considered broken when price wicks through it
Disabled:
A level is only broken when price closes beyond it
This allows adaptation for:
Aggressive (wick-based liquidity grabs)
Conservative (confirmed close-based breaks)
Alerts
The script includes two types of alerts:
1. Swing Creation Alerts
Triggered when a new level forms:
New Swing High
New Swing Low
Useful for:
Tracking fresh structure
Identifying new liquidity zones
2. Break Alerts
Triggered when price crosses any active level:
Swing High Broken
Swing Low Broken
Behavior:
Fires as soon as price breaches a level (based on wick/close setting)
Works across all active swing levels simultaneously
Useful for:
Breakout entries
Liquidity sweeps
Structure shifts
Internal Tracking System
Uses arrays to store:
Active swing lines
Corresponding price levels
Continuously checks each level for break conditions
Efficiently removes invalidated levels in real time
Visual Customization
Adjustable colors for highs and lows
Configurable line width
Selectable line style:
Solid
Dashed
Dotted
Use Case
This indicator is built for traders who rely on:
Market structure
Liquidity sweeps
Breakout confirmation
Clean chart visualization without outdated levels
It ensures that only relevant, unbroken swing levels remain on the chart while providing immediate alerts when those levels are created or taken out.
Open-source Skript
Ganz im Sinne von TradingView hat dieser Autor sein/ihr Script als Open-Source veröffentlicht. Auf diese Weise können nun auch andere Trader das Script rezensieren und die Funktionalität überprüfen. Vielen Dank an den Autor! Sie können das Script kostenlos verwenden, aber eine Wiederveröffentlichung des Codes unterliegt unseren Hausregeln.

Haftungsausschluss
Die Informationen und Veröffentlichungen sind nicht als Finanz-, Anlage-, Handels- oder andere Arten von Ratschlägen oder Empfehlungen gedacht, die von TradingView bereitgestellt oder gebilligt werden, und stellen diese nicht dar. Lesen Sie mehr in den Nutzungsbedingungen.
Open-source Skript
Ganz im Sinne von TradingView hat dieser Autor sein/ihr Script als Open-Source veröffentlicht. Auf diese Weise können nun auch andere Trader das Script rezensieren und die Funktionalität überprüfen. Vielen Dank an den Autor! Sie können das Script kostenlos verwenden, aber eine Wiederveröffentlichung des Codes unterliegt unseren Hausregeln.
Haftungsausschluss
Die Informationen und Veröffentlichungen sind nicht als Finanz-, Anlage-, Handels- oder andere Arten von Ratschlägen oder Empfehlungen gedacht, die von TradingView bereitgestellt oder gebilligt werden, und stellen diese nicht dar. Lesen Sie mehr in den Nutzungsbedingungen.