Trend Zone Flow [AxeAlgo]
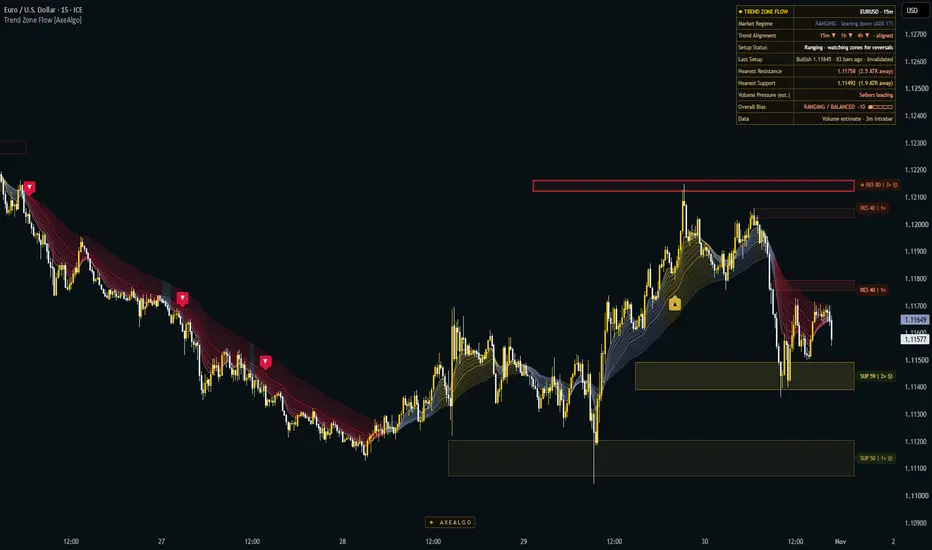
Trend Zone Flow reads the market through three questions every discretionary trader asks: Which way is the trend? Where are the important levels? Who is pushing right now? It answers each with its own engine, then combines them into one confluence read, a plain-language dashboard and bar-close setup markers.
It is a context tool. It shows where trend, structure and volume pressure agree. It does not predict price and it is not a trading system.
HOW IT WORKS
1. Trend & Regime: 12-band McGinley ribbon
Twelve adaptive curves based on John R. McGinley's McGinley Dynamic (lengths 8 to 52) share one speed factor taken from the length-25 core band, so the whole ribbon speeds up and slows down together. Band ordering, ribbon spread, core slope and ADX classify the market into one of four regimes:
• Trend Up (gold)
• Trend Down (crimson)
• Ranging (slate)
• Volatile / No-Trade (purple)
A hysteresis gate stops single-bar flips, and a flip-rate filter pauses setups when the regime keeps changing (chop).
2. Structure: support & resistance zones
Confirmed swing pivots are clustered into zones. Swings that land close together merge into one zone instead of stacking duplicate levels.
Each zone's strength (0–100) is built from:
• distinct reactions, counted at least 5 bars apart so one swing is never counted twice
• how far price moved away from the zone after reacting
• alignment with a higher-timeframe swing level
• a clear volume spike (2× the 20-bar average) on the swing that formed the zone or its first two reactions (marked Ⓥ on the badge)
• proximity to a round number
Only the 3–5 most relevant zones near price are shown. A broken zone flips role once (support becomes resistance or the reverse) and is removed if it breaks again. Zones marked ★ have a strength of 80 or more.
3. Volume Pressure (estimated delta & CVD)
Buying vs. selling pressure is estimated from lower-timeframe candles (or from the chart bar in the faster mode). Each candle's volume is weighted by where it closes within its range. This builds a cumulative delta (CVD) that resets daily or weekly, plus absorption (heavy volume, little progress) and CVD divergence at swing points.
Important: TradingView indicators cannot access real bid/ask order-flow data. Every delta value here is an estimate, and the dashboard always shows which data source is in use.
WHY THESE THREE ARE COMBINED
Each pillar on its own has a well-known weakness:
• Trend tools say "up" but not where to engage.
• Zones say where, but not whether price is likely to respect them.
• Volume pressure says who is active, but not in what context.
Trend Zone Flow scores each pillar separately for bulls and for bears:
• Trend: 35%
• Structure: 35%
• Volume pressure: 30%
Structure only scores fully when price actually reacts at a zone (a wick rejection), not merely when it is nearby. On symbols without volume, the weights rebalance automatically to 50% trend / 50% structure.
The result is two independent scores (bullish 0–100 and bearish 0–100). The dashboard shows their net difference as the Overall Bias.
SETUP MARKERS
A ▲ bullish or ▼ bearish setup is marked only when the pillars agree and the candle confirms. There are three types:
• Trend continuation: price pulls back into the ribbon (or to a zone) in an established trend, then resumes with a strong-bodied close. By default it must also agree with the higher-timeframe trend (for example, 15m uses 4h and 1h uses Daily).
• Reversal: a confirmed rejection at a support or resistance zone, or a reclaim of the ribbon core after a trend. Reversals are off on 1h and higher charts unless you enable them.
• Momentum surge (All Setups mode only): very strong one-sided confluence with a decisive candle.
Discipline rules:
• one setup per trend wave (Aggressive allows a second, only after a fresh retest)
• no setups when price is stretched far from the ribbon
• a cooldown between setups
• setups that conflict on the same bar cancel each other
Hover any marker to see why it appeared: regime, trigger, higher-timeframe trend, volume pressure, confluence, invalidation level and the next opposing zone.
Optional "Show Active Setup Levels" draws the latest setup's invalidation level (dotted) and the next opposing zone (dashed). Both lines are removed as soon as the setup is invalidated, the trend flips or it expires, so the chart only ever shows one live setup's levels.
All setups are confirmed on bar close and do not repaint. Higher-timeframe values use closed higher-timeframe candles only. Zones keep updating as new structure forms, as any S/R tool does.
DASHBOARD
• Market Regime: current regime and its strength, or "just started" for a new regime. A range shows "leaning up / down" when price is on the same side of the core on all three timeframes.
• Trend Alignment: chart, middle and higher timeframe direction at a glance
• Setup Status: what the engine is waiting for right now, in plain words
• Last Setup: direction, price, bars ago and status (Active, Invalidated, Trend flipped or Expired)
• Nearest Resistance / Support: price and distance in ATR
• Volume Pressure: buyers leading, sellers leading or mixed
• Overall Bias: net confluence with a meter, flagged when it leans against the higher-timeframe trend
• Data: which volume source is being used
SETTINGS (kept simple on purpose)
• Setups: Setup Type (Trend + Reversals / Trend Only / Reversals Only / All Setups), Sensitivity (Conservative / Balanced / Aggressive), higher-timeframe filter, marker style, optional active setup levels
• Support & Resistance Zones: how many zones, label style, past and broken zones
• Trend Ribbon: 12-band, 6-band, core line only, or off
• Dashboard: position, size, theme
• Volume Pressure: data source, estimation method, CVD reset
• Colors and watermark (the watermark can be hidden)
• Advanced (optional): ribbon speed, ADX threshold, swing length and confirmation bars, zone merge distance, maximum distance from the ribbon
The defaults are a sensible starting point for most markets and timeframes.
ALERTS
• TZF Bullish Setup / TZF Bearish Setup
• Strong Bullish / Bearish Confluence
• Confluence Bias Shift
• S/R Zone Rejection Event
For alerts that include the full reasoning text, create an alert with "Any alert() function call". This also notifies you when the last setup is invalidated.
HOW TO USE IT
• Use the regime and trend alignment to decide which side you favour.
• Use zones as locations to watch and as reference targets, not as automatic entries.
• Treat a setup marker as "conditions lined up here". Then apply your own entry, stop and risk rules. The tooltip's invalidation level is a structural reference, not a recommended stop.
LIMITATIONS
• Volume delta is estimated from candle data. It is not true order flow, and quality depends on the symbol's volume feed. On forex and CFDs volume is usually tick volume (number of price changes), so treat the Volume Pressure pillar and Ⓥ marks there as rougher estimates.
• Lower-timeframe detail is limited by how much intrabar history TradingView provides. Older bars fall back to the chart-bar estimate.
• Like every trend tool, the ribbon lags at turning points, and setups are rarer in ranging markets by design.
• The confluence score measures how much the inputs agree. It is not a win probability.
DISCLAIMER
This script is for educational and analytical purposes only. It is not financial advice, does not guarantee any result, and past behaviour on a chart does not indicate future performance. Always use your own judgement and risk management.
It is a context tool. It shows where trend, structure and volume pressure agree. It does not predict price and it is not a trading system.
HOW IT WORKS
1. Trend & Regime: 12-band McGinley ribbon
Twelve adaptive curves based on John R. McGinley's McGinley Dynamic (lengths 8 to 52) share one speed factor taken from the length-25 core band, so the whole ribbon speeds up and slows down together. Band ordering, ribbon spread, core slope and ADX classify the market into one of four regimes:
• Trend Up (gold)
• Trend Down (crimson)
• Ranging (slate)
• Volatile / No-Trade (purple)
A hysteresis gate stops single-bar flips, and a flip-rate filter pauses setups when the regime keeps changing (chop).
2. Structure: support & resistance zones
Confirmed swing pivots are clustered into zones. Swings that land close together merge into one zone instead of stacking duplicate levels.
Each zone's strength (0–100) is built from:
• distinct reactions, counted at least 5 bars apart so one swing is never counted twice
• how far price moved away from the zone after reacting
• alignment with a higher-timeframe swing level
• a clear volume spike (2× the 20-bar average) on the swing that formed the zone or its first two reactions (marked Ⓥ on the badge)
• proximity to a round number
Only the 3–5 most relevant zones near price are shown. A broken zone flips role once (support becomes resistance or the reverse) and is removed if it breaks again. Zones marked ★ have a strength of 80 or more.
3. Volume Pressure (estimated delta & CVD)
Buying vs. selling pressure is estimated from lower-timeframe candles (or from the chart bar in the faster mode). Each candle's volume is weighted by where it closes within its range. This builds a cumulative delta (CVD) that resets daily or weekly, plus absorption (heavy volume, little progress) and CVD divergence at swing points.
Important: TradingView indicators cannot access real bid/ask order-flow data. Every delta value here is an estimate, and the dashboard always shows which data source is in use.
WHY THESE THREE ARE COMBINED
Each pillar on its own has a well-known weakness:
• Trend tools say "up" but not where to engage.
• Zones say where, but not whether price is likely to respect them.
• Volume pressure says who is active, but not in what context.
Trend Zone Flow scores each pillar separately for bulls and for bears:
• Trend: 35%
• Structure: 35%
• Volume pressure: 30%
Structure only scores fully when price actually reacts at a zone (a wick rejection), not merely when it is nearby. On symbols without volume, the weights rebalance automatically to 50% trend / 50% structure.
The result is two independent scores (bullish 0–100 and bearish 0–100). The dashboard shows their net difference as the Overall Bias.
SETUP MARKERS
A ▲ bullish or ▼ bearish setup is marked only when the pillars agree and the candle confirms. There are three types:
• Trend continuation: price pulls back into the ribbon (or to a zone) in an established trend, then resumes with a strong-bodied close. By default it must also agree with the higher-timeframe trend (for example, 15m uses 4h and 1h uses Daily).
• Reversal: a confirmed rejection at a support or resistance zone, or a reclaim of the ribbon core after a trend. Reversals are off on 1h and higher charts unless you enable them.
• Momentum surge (All Setups mode only): very strong one-sided confluence with a decisive candle.
Discipline rules:
• one setup per trend wave (Aggressive allows a second, only after a fresh retest)
• no setups when price is stretched far from the ribbon
• a cooldown between setups
• setups that conflict on the same bar cancel each other
Hover any marker to see why it appeared: regime, trigger, higher-timeframe trend, volume pressure, confluence, invalidation level and the next opposing zone.
Optional "Show Active Setup Levels" draws the latest setup's invalidation level (dotted) and the next opposing zone (dashed). Both lines are removed as soon as the setup is invalidated, the trend flips or it expires, so the chart only ever shows one live setup's levels.
All setups are confirmed on bar close and do not repaint. Higher-timeframe values use closed higher-timeframe candles only. Zones keep updating as new structure forms, as any S/R tool does.
DASHBOARD
• Market Regime: current regime and its strength, or "just started" for a new regime. A range shows "leaning up / down" when price is on the same side of the core on all three timeframes.
• Trend Alignment: chart, middle and higher timeframe direction at a glance
• Setup Status: what the engine is waiting for right now, in plain words
• Last Setup: direction, price, bars ago and status (Active, Invalidated, Trend flipped or Expired)
• Nearest Resistance / Support: price and distance in ATR
• Volume Pressure: buyers leading, sellers leading or mixed
• Overall Bias: net confluence with a meter, flagged when it leans against the higher-timeframe trend
• Data: which volume source is being used
SETTINGS (kept simple on purpose)
• Setups: Setup Type (Trend + Reversals / Trend Only / Reversals Only / All Setups), Sensitivity (Conservative / Balanced / Aggressive), higher-timeframe filter, marker style, optional active setup levels
• Support & Resistance Zones: how many zones, label style, past and broken zones
• Trend Ribbon: 12-band, 6-band, core line only, or off
• Dashboard: position, size, theme
• Volume Pressure: data source, estimation method, CVD reset
• Colors and watermark (the watermark can be hidden)
• Advanced (optional): ribbon speed, ADX threshold, swing length and confirmation bars, zone merge distance, maximum distance from the ribbon
The defaults are a sensible starting point for most markets and timeframes.
ALERTS
• TZF Bullish Setup / TZF Bearish Setup
• Strong Bullish / Bearish Confluence
• Confluence Bias Shift
• S/R Zone Rejection Event
For alerts that include the full reasoning text, create an alert with "Any alert() function call". This also notifies you when the last setup is invalidated.
HOW TO USE IT
• Use the regime and trend alignment to decide which side you favour.
• Use zones as locations to watch and as reference targets, not as automatic entries.
• Treat a setup marker as "conditions lined up here". Then apply your own entry, stop and risk rules. The tooltip's invalidation level is a structural reference, not a recommended stop.
LIMITATIONS
• Volume delta is estimated from candle data. It is not true order flow, and quality depends on the symbol's volume feed. On forex and CFDs volume is usually tick volume (number of price changes), so treat the Volume Pressure pillar and Ⓥ marks there as rougher estimates.
• Lower-timeframe detail is limited by how much intrabar history TradingView provides. Older bars fall back to the chart-bar estimate.
• Like every trend tool, the ribbon lags at turning points, and setups are rarer in ranging markets by design.
• The confluence score measures how much the inputs agree. It is not a win probability.
DISCLAIMER
This script is for educational and analytical purposes only. It is not financial advice, does not guarantee any result, and past behaviour on a chart does not indicate future performance. Always use your own judgement and risk management.

◆ AxeAlgo | axealgo.com
6 years building Pine Script indicators & strategies
6 years building Pine Script indicators & strategies
Haftungsausschluss
Die Informationen und Veröffentlichungen sind nicht als Finanz-, Anlage-, Handels- oder andere Arten von Ratschlägen oder Empfehlungen gedacht, die von TradingView bereitgestellt oder gebilligt werden, und stellen diese nicht dar. Lesen Sie mehr in den Nutzungsbedingungen.
◆ AxeAlgo | axealgo.com
6 years building Pine Script indicators & strategies
6 years building Pine Script indicators & strategies
Haftungsausschluss
Die Informationen und Veröffentlichungen sind nicht als Finanz-, Anlage-, Handels- oder andere Arten von Ratschlägen oder Empfehlungen gedacht, die von TradingView bereitgestellt oder gebilligt werden, und stellen diese nicht dar. Lesen Sie mehr in den Nutzungsbedingungen.