OPEN-SOURCE SCRIPT
SVKO CFD Stocks & NQ-ES Real Volume
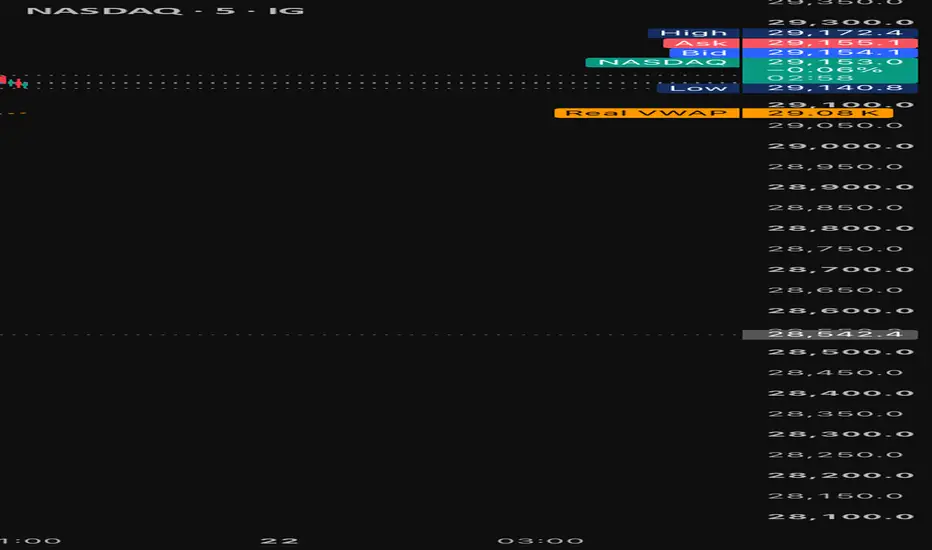
SVKO CFD Stocks & NQ-ES Real Volume replaces broker CFD volume with native stock volume or a configurable activity proxy for Nasdaq 100 and S&P 500 CFDs. It can also use the selected external volume to calculate an optional Real VWAP on the CFD price.
█ OVERVIEW
For a stock CFD, the indicator can use the corresponding exchange-listed share volume. For an index CFD, it can combine Micro E-mini futures, E-mini futures, and a major tracking ETF with user-defined positive weights.
The NQ and ES result is a transparent activity proxy. It does not claim to reconstruct an official consolidated index-volume measurement.
█ HOW IT WORKS
The indicator selects the Volume formulas entry whose left side matches the current standard chart ticker. Each term on the right can be a complete TradingView ticker, a configured abbreviation, or a positively weighted symbol.
TRADENATION:NVDA.EX = NASDAQ:NVDA
The default Nasdaq 100 example, `MNQ + 10*NQ + 60*QQQ`, follows the author's practical normalisation by typical relative leverage and exposure. QQQ receives the largest coefficient because it typically has the least leverage, while MNQ and NQ provide greater leveraged exposure. NQ receives a coefficient of 10 because one NQ contract is exactly ten times the size of one MNQ contract. The coefficient of 60 for QQQ is the author's adjustable example for bringing its activity with less leverage onto a comparable scale. The S&P 500 example uses the same reasoning with MES, ES, and SPY. These weights express the author's proxy logic and can be changed. They are not a conversion defined by an exchange.
Each unique active source is requested once per chart update. Repeated sources are combined before requests. Missing sources can contribute zero after they have produced valid data, while remaining sources continue to contribute.
External volume is displayed as standard up and down columns in a dedicated pane. The optional Real VWAP uses this calculated "real" volume, including all active formula weights, to weight the current CFD's price. It can follow either a main-session or full-session anchor.
█ MAPPING AND FALLBACK
An explicit volume formula always has priority. This supports precise stock mappings, deliberately selected sources, and weighted index proxies.
When no formula matches, supported broker charts can use SVKO CFD Symbol Mapper as a one-symbol fallback. Connect 1st code to Map: 1st code and 2nd code to Map: 2nd code from the same Mapper instance.
█ HOW TO USE
• Add the indicator to a standard time-based chart.
• Check whether Volume formulas already contains the chart symbol or one of its abbreviations.
• Add or edit a formula when a specific source or weighted proxy is required.
• Add SVKO CFD Symbol Mapper and connect both code inputs when the general stock-CFD fallback is required.
• Use TradingView's Style tab to configure the volume columns and Real VWAP.
• Choose the session anchor used by Real VWAP.
█ LIMITATIONS
A stock source represents the reported volume of the selected TradingView symbol. A multi-source NQ or ES formula is a user-defined weighted proxy, not an exchange-defined consolidated volume value.
Feed availability, delays, subscription permissions, sessions, and bar alignment can differ between sources. Missing data can make the result incomplete. Current volume and Real VWAP can change until an open realtime bar closes. No future data is used.
Session-anchored VWAP contains less intraday detail on daily and higher timeframes. Unsupported charts and unresolved Mapper results draw nothing and make no fallback volume request.
█ ALERTS
This indicator does not define alert conditions.
█ CREDITS AND LICENCE
Original work by SVKO. Published open source under the Mozilla Public License 2.0.
█ OVERVIEW
For a stock CFD, the indicator can use the corresponding exchange-listed share volume. For an index CFD, it can combine Micro E-mini futures, E-mini futures, and a major tracking ETF with user-defined positive weights.
The NQ and ES result is a transparent activity proxy. It does not claim to reconstruct an official consolidated index-volume measurement.
█ HOW IT WORKS
The indicator selects the Volume formulas entry whose left side matches the current standard chart ticker. Each term on the right can be a complete TradingView ticker, a configured abbreviation, or a positively weighted symbol.
TRADENATION:NVDA.EX = NASDAQ:NVDA
The default Nasdaq 100 example, `MNQ + 10*NQ + 60*QQQ`, follows the author's practical normalisation by typical relative leverage and exposure. QQQ receives the largest coefficient because it typically has the least leverage, while MNQ and NQ provide greater leveraged exposure. NQ receives a coefficient of 10 because one NQ contract is exactly ten times the size of one MNQ contract. The coefficient of 60 for QQQ is the author's adjustable example for bringing its activity with less leverage onto a comparable scale. The S&P 500 example uses the same reasoning with MES, ES, and SPY. These weights express the author's proxy logic and can be changed. They are not a conversion defined by an exchange.
Each unique active source is requested once per chart update. Repeated sources are combined before requests. Missing sources can contribute zero after they have produced valid data, while remaining sources continue to contribute.
External volume is displayed as standard up and down columns in a dedicated pane. The optional Real VWAP uses this calculated "real" volume, including all active formula weights, to weight the current CFD's price. It can follow either a main-session or full-session anchor.
█ MAPPING AND FALLBACK
An explicit volume formula always has priority. This supports precise stock mappings, deliberately selected sources, and weighted index proxies.
When no formula matches, supported broker charts can use SVKO CFD Symbol Mapper as a one-symbol fallback. Connect 1st code to Map: 1st code and 2nd code to Map: 2nd code from the same Mapper instance.
█ HOW TO USE
• Add the indicator to a standard time-based chart.
• Check whether Volume formulas already contains the chart symbol or one of its abbreviations.
• Add or edit a formula when a specific source or weighted proxy is required.
• Add SVKO CFD Symbol Mapper and connect both code inputs when the general stock-CFD fallback is required.
• Use TradingView's Style tab to configure the volume columns and Real VWAP.
• Choose the session anchor used by Real VWAP.
█ LIMITATIONS
A stock source represents the reported volume of the selected TradingView symbol. A multi-source NQ or ES formula is a user-defined weighted proxy, not an exchange-defined consolidated volume value.
Feed availability, delays, subscription permissions, sessions, and bar alignment can differ between sources. Missing data can make the result incomplete. Current volume and Real VWAP can change until an open realtime bar closes. No future data is used.
Session-anchored VWAP contains less intraday detail on daily and higher timeframes. Unsupported charts and unresolved Mapper results draw nothing and make no fallback volume request.
█ ALERTS
This indicator does not define alert conditions.
█ CREDITS AND LICENCE
Original work by SVKO. Published open source under the Mozilla Public License 2.0.
Open-source Skript
Ganz im Sinne von TradingView hat dieser Autor sein/ihr Script als Open-Source veröffentlicht. Auf diese Weise können nun auch andere Trader das Script rezensieren und die Funktionalität überprüfen. Vielen Dank an den Autor! Sie können das Script kostenlos verwenden, aber eine Wiederveröffentlichung des Codes unterliegt unseren Hausregeln.

Haftungsausschluss
Die Informationen und Veröffentlichungen sind nicht als Finanz-, Anlage-, Handels- oder andere Arten von Ratschlägen oder Empfehlungen gedacht, die von TradingView bereitgestellt oder gebilligt werden, und stellen diese nicht dar. Lesen Sie mehr in den Nutzungsbedingungen.
Open-source Skript
Ganz im Sinne von TradingView hat dieser Autor sein/ihr Script als Open-Source veröffentlicht. Auf diese Weise können nun auch andere Trader das Script rezensieren und die Funktionalität überprüfen. Vielen Dank an den Autor! Sie können das Script kostenlos verwenden, aber eine Wiederveröffentlichung des Codes unterliegt unseren Hausregeln.
Haftungsausschluss
Die Informationen und Veröffentlichungen sind nicht als Finanz-, Anlage-, Handels- oder andere Arten von Ratschlägen oder Empfehlungen gedacht, die von TradingView bereitgestellt oder gebilligt werden, und stellen diese nicht dar. Lesen Sie mehr in den Nutzungsbedingungen.