SMT AND CISD BY RIZ.FX
SMT compares two correlated markets (like NQ vs. ES or EUR/USD vs. GBP/USD) to see if they are out of sync. If one asset makes a new high/low but the other fails to follow, it signals a potential trend reversal or institutional manipulation.
How it marks your chart:
S1 (Stage 1 SMT): Marks the first SMT divergence detected in a price move.
S2 (Stage 2 SMT): Marks a second back-to-back SMT divergence in the same direction.
SSMT: An option in settings to label major Higher-Timeframe SMTs.
Visual Style: Draws a solid orange line connecting the two price swings, with black text sitting cleanly ON TOP of the line.
2. CISD Engine (The Red Lines)
What it does:
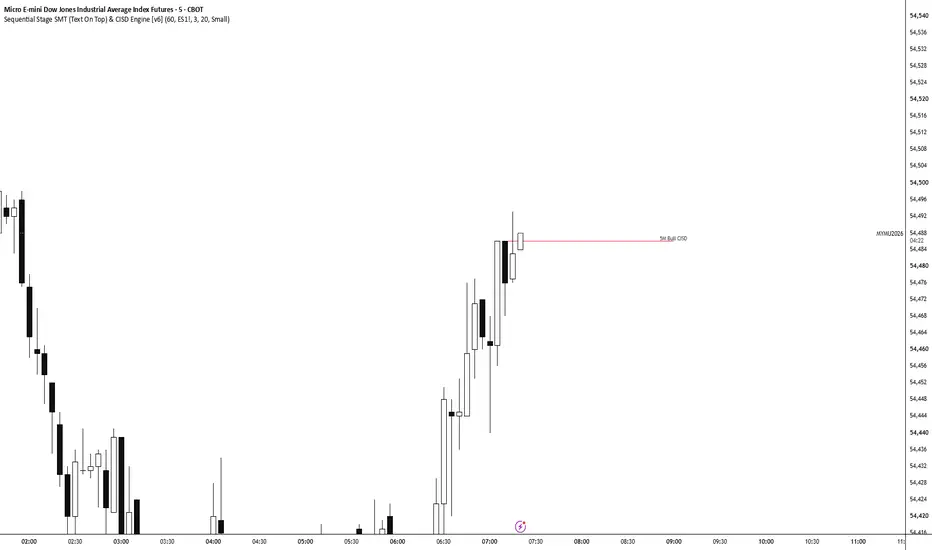
CISD (Change in State of Delivery) highlights exact price levels where market momentum flips. It triggers when price breaks and closes beyond the open price of an opposing candle, signaling that market makers are shifting price direction.
How it marks your chart:
Bullish CISD: Placed when price pushes up through a previous down-candle's open price.
Bearish CISD: Placed when price pushes down through a previous up-candle's open price.
Visual Style: Draws a horizontal solid red line with black text on the far RIGHT side showing the timeframe (e.g., 5M Bull CISD).
How it marks your chart:
S1 (Stage 1 SMT): Marks the first SMT divergence detected in a price move.
S2 (Stage 2 SMT): Marks a second back-to-back SMT divergence in the same direction.
SSMT: An option in settings to label major Higher-Timeframe SMTs.
Visual Style: Draws a solid orange line connecting the two price swings, with black text sitting cleanly ON TOP of the line.
2. CISD Engine (The Red Lines)
What it does:
CISD (Change in State of Delivery) highlights exact price levels where market momentum flips. It triggers when price breaks and closes beyond the open price of an opposing candle, signaling that market makers are shifting price direction.
How it marks your chart:
Bullish CISD: Placed when price pushes up through a previous down-candle's open price.
Bearish CISD: Placed when price pushes down through a previous up-candle's open price.
Visual Style: Draws a horizontal solid red line with black text on the far RIGHT side showing the timeframe (e.g., 5M Bull CISD).

Haftungsausschluss
Die Informationen und Veröffentlichungen sind nicht als Finanz-, Anlage-, Handels- oder andere Arten von Ratschlägen oder Empfehlungen gedacht, die von TradingView bereitgestellt oder gebilligt werden, und stellen diese nicht dar. Lesen Sie mehr in den Nutzungsbedingungen.
Haftungsausschluss
Die Informationen und Veröffentlichungen sind nicht als Finanz-, Anlage-, Handels- oder andere Arten von Ratschlägen oder Empfehlungen gedacht, die von TradingView bereitgestellt oder gebilligt werden, und stellen diese nicht dar. Lesen Sie mehr in den Nutzungsbedingungen.